Immigrants from Norway vs West Indian Child Poverty Under the Age of 16

COMPARE

Immigrants from Norway
Race
Ancestry
AfghanAfricanAlaska NativeAlaskan AthabascanAlbanianAleutAlsatianAmericanApacheArabArapahoArgentineanArmenianAssyrian/Chaldean/SyriacAustralianAustrianBahamianBangladeshiBarbadianBasqueBelgianBelizeanBermudanBhutaneseBlackfeetBolivianBrazilianBritishBritish West IndianBulgarianBurmeseCajunCambodianCanadianCape VerdeanCarpatho RusynCelticCentral AmericanCentral American IndianCherokeeCheyenneChickasawChileanChineseChippewaChoctawColombianColvilleComancheCosta RicanCreeCreekCroatianCrowCubanCypriotCzechCzechoslovakianDanishDelawareDominicanDutchDutch West IndianEastern EuropeanEcuadorianEgyptianEnglishEstonianEthiopianEuropeanFijianFilipinoFinnishFrenchFrench American IndianFrench CanadianGermanGerman RussianGhanaianGreekGuamanian/ChamorroGuatemalanGuyaneseHaitianHmongHonduranHopiHoumaHungarianIcelanderIndian (Asian)IndonesianInupiatIranianIraqiIrishIroquoisIsraeliItalianJamaicanJapaneseJordanianKenyanKiowaKoreanLaotianLatvianLebaneseLiberianLithuanianLumbeeLuxembourgerMacedonianMalaysianMalteseMarshalleseMenomineeMexicanMexican American IndianMongolianMoroccanNative HawaiianNavajoNepaleseNew ZealanderNicaraguanNigerianNorthern EuropeanNorwegianOkinawanOsageOttawaPaiutePakistaniPalestinianPanamanianParaguayanPennsylvania GermanPeruvianPimaPolishPortuguesePotawatomiPuebloPuerto RicanPuget Sound SalishRomanianRussianSalvadoranSamoanScandinavianScotch-IrishScottishSeminoleSenegaleseSerbianShoshoneSierra LeoneanSiouxSlavicSlovakSloveneSomaliSouth AfricanSouth AmericanSouth American IndianSoviet UnionSpaniardSpanishSpanish AmericanSpanish American IndianSri LankanSubsaharan AfricanSudaneseSwedishSwissSyrianTaiwaneseThaiTlingit-HaidaTohono O'OdhamTonganTrinidadian and TobagonianTsimshianTurkishU.S. Virgin IslanderUgandanUkrainianUruguayanUteVenezuelanVietnameseWelshYakamaYaquiYugoslavianYumanYup'ikZimbabwean
Immigration
NonimmigrantsImmigrantsAfghanistanAfricaAlbaniaArgentinaArmeniaAsiaAustraliaAustriaBahamasBangladeshBarbadosBelarusBelgiumBelizeBoliviaBosnia and HerzegovinaBrazilBulgariaBurma/MyanmarCabo VerdeCambodiaCameroonCanadaCaribbeanCentral AmericaChileChinaColombiaCongoCosta RicaCroatiaCubaCzechoslovakiaDenmarkDominicaDominican RepublicEastern AfricaEastern AsiaEastern EuropeEcuadorEgyptEl SalvadorEnglandEritreaEthiopiaEuropeFijiFranceGermanyGhanaGreeceGrenadaGuatemalaGuyanaHaitiHondurasHong KongHungaryIndiaIndonesiaIranIraqIrelandIsraelItalyJamaicaJapanJordanKazakhstanKenyaKoreaKuwaitLaosLatin AmericaLatviaLebanonLiberiaLithuaniaMalaysiaMexicoMicronesiaMiddle AfricaMoldovaMoroccoNepalNetherlandsNicaraguaNigeriaNorth AmericaNorth MacedoniaNorthern AfricaNorthern EuropeNorwayOceaniaPakistanPanamaPeruPhilippinesPolandPortugalRomaniaRussiaSaudi ArabiaScotlandSenegalSerbiaSierra LeoneSingaporeSomaliaSouth AfricaSouth AmericaSouth Central AsiaSouth Eastern AsiaSouthern EuropeSpainSri LankaSt. Vincent and the GrenadinesSudanSwedenSwitzerlandSyriaTaiwanThailandTrinidad and TobagoTurkeyUgandaUkraineUruguayUzbekistanVenezuelaVietnamWest IndiesWestern AfricaWestern AsiaWestern EuropeYemenZaireZimbabweAzores
West Indian
Race
Ancestry
AfghanAfricanAlaska NativeAlaskan AthabascanAlbanianAleutAlsatianAmericanApacheArabArapahoArgentineanArmenianAssyrian/Chaldean/SyriacAustralianAustrianBahamianBangladeshiBarbadianBasqueBelgianBelizeanBermudanBhutaneseBlackfeetBolivianBrazilianBritishBritish West IndianBulgarianBurmeseCajunCambodianCanadianCape VerdeanCarpatho RusynCelticCentral AmericanCentral American IndianCherokeeCheyenneChickasawChileanChineseChippewaChoctawColombianColvilleComancheCosta RicanCreeCreekCroatianCrowCubanCypriotCzechCzechoslovakianDanishDelawareDominicanDutchDutch West IndianEastern EuropeanEcuadorianEgyptianEnglishEstonianEthiopianEuropeanFijianFilipinoFinnishFrenchFrench American IndianFrench CanadianGermanGerman RussianGhanaianGreekGuamanian/ChamorroGuatemalanGuyaneseHaitianHmongHonduranHopiHoumaHungarianIcelanderIndian (Asian)IndonesianInupiatIranianIraqiIrishIroquoisIsraeliItalianJamaicanJapaneseJordanianKenyanKiowaKoreanLaotianLatvianLebaneseLiberianLithuanianLumbeeLuxembourgerMacedonianMalaysianMalteseMarshalleseMenomineeMexicanMexican American IndianMongolianMoroccanNative HawaiianNavajoNepaleseNew ZealanderNicaraguanNigerianNorthern EuropeanNorwegianOkinawanOsageOttawaPaiutePakistaniPalestinianPanamanianParaguayanPennsylvania GermanPeruvianPimaPolishPortuguesePotawatomiPuebloPuerto RicanPuget Sound SalishRomanianRussianSalvadoranSamoanScandinavianScotch-IrishScottishSeminoleSenegaleseSerbianShoshoneSierra LeoneanSiouxSlavicSlovakSloveneSomaliSouth AfricanSouth AmericanSouth American IndianSoviet UnionSpaniardSpanishSpanish AmericanSpanish American IndianSri LankanSubsaharan AfricanSudaneseSwedishSwissSyrianTaiwaneseThaiTlingit-HaidaTohono O'OdhamTonganTrinidadian and TobagonianTsimshianTurkishU.S. Virgin IslanderUgandanUkrainianUruguayanUteVenezuelanVietnameseWelshWest IndianYakamaYaquiYugoslavianYumanYup'ikZimbabwean
Immigration
NonimmigrantsImmigrantsAfghanistanAfricaAlbaniaArgentinaArmeniaAsiaAustraliaAustriaBahamasBangladeshBarbadosBelarusBelgiumBelizeBoliviaBosnia and HerzegovinaBrazilBulgariaBurma/MyanmarCabo VerdeCambodiaCameroonCanadaCaribbeanCentral AmericaChileChinaColombiaCongoCosta RicaCroatiaCubaCzechoslovakiaDenmarkDominicaDominican RepublicEastern AfricaEastern AsiaEastern EuropeEcuadorEgyptEl SalvadorEnglandEritreaEthiopiaEuropeFijiFranceGermanyGhanaGreeceGrenadaGuatemalaGuyanaHaitiHondurasHong KongHungaryIndiaIndonesiaIranIraqIrelandIsraelItalyJamaicaJapanJordanKazakhstanKenyaKoreaKuwaitLaosLatin AmericaLatviaLebanonLiberiaLithuaniaMalaysiaMexicoMicronesiaMiddle AfricaMoldovaMoroccoNepalNetherlandsNicaraguaNigeriaNorth AmericaNorth MacedoniaNorthern AfricaNorthern EuropeOceaniaPakistanPanamaPeruPhilippinesPolandPortugalRomaniaRussiaSaudi ArabiaScotlandSenegalSerbiaSierra LeoneSingaporeSomaliaSouth AfricaSouth AmericaSouth Central AsiaSouth Eastern AsiaSouthern EuropeSpainSri LankaSt. Vincent and the GrenadinesSudanSwedenSwitzerlandSyriaTaiwanThailandTrinidad and TobagoTurkeyUgandaUkraineUruguayUzbekistanVenezuelaVietnamWest IndiesWestern AfricaWestern AsiaWestern EuropeYemenZaireZimbabweAzores
Child Poverty Under the Age of 16
Income
Poverty
Unemployment
Labor Participation
Family Structure
Vehicle Availability
Education Level
Disability

Child Poverty Under the Age of 16 Comparison

Immigrants from Norway

West Indians

Exceptional
Tragic
15.0%
CHILD POVERTY UNDER THE AGE OF 16
92.8/ 100
METRIC RATING
117th/ 347
METRIC RANK
20.1%
CHILD POVERTY UNDER THE AGE OF 16
0.0/ 100
METRIC RATING
284th/ 347
METRIC RANK

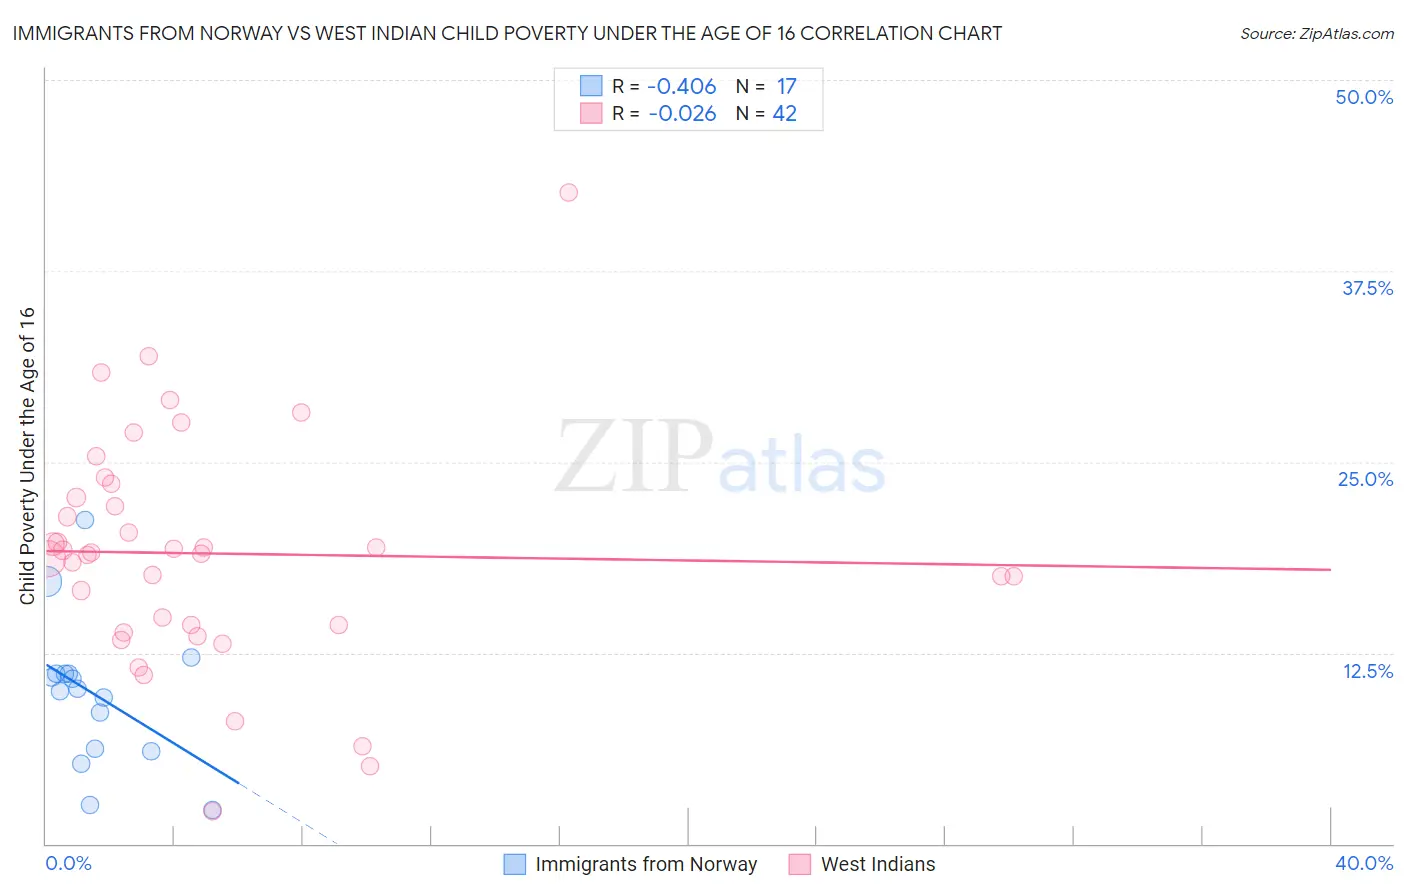
Immigrants from Norway vs West Indian Child Poverty Under the Age of 16 Correlation Chart

The statistical analysis conducted on geographies consisting of 116,192,313 people shows a moderate negative correlation between the proportion of Immigrants from Norway and poverty level among children under the age of 16 in the United States with a correlation coefficient (R) of -0.406 and weighted average of 15.0%. Similarly, the statistical analysis conducted on geographies consisting of 252,918,543 people shows no correlation between the proportion of West Indians and poverty level among children under the age of 16 in the United States with a correlation coefficient (R) of -0.026 and weighted average of 20.1%, a difference of 34.5%.
Immigrants from Norway vs West Indian Child Poverty Under the Age of 16

Child Poverty Under the Age of 16 Correlation Summary

MeasurementImmigrants from NorwayWest Indian
Minimum2.2%2.1%
Maximum21.2%42.6%
Range19.0%40.5%
Mean9.8%19.0%
Median10.2%19.0%
Interquartile 25% (IQ1)6.1%14.3%
Interquartile 75% (IQ3)11.1%22.6%
Interquartile Range (IQR)5.0%8.3%
Standard Deviation (Sample)4.7%7.6%
Standard Deviation (Population)4.6%7.5%

Similar Demographics by Child Poverty Under the Age of 16

Demographics Similar to Immigrants from Norway by Child Poverty Under the Age of 16

In terms of child poverty under the age of 16, the demographic groups most similar to Immigrants from Norway are Immigrants from Malaysia (15.0%, a difference of 0.060%), Carpatho Rusyn (14.9%, a difference of 0.15%), Immigrants from Ukraine (14.9%, a difference of 0.17%), Scottish (15.0%, a difference of 0.21%), and Sri Lankan (14.9%, a difference of 0.23%).
DemographicsRating | RankChild Poverty Under the Age of 16
English
93.5
/100
|
#110
Exceptional
14.9%
Immigrants | Denmark
93.5
/100
|
#111
Exceptional
14.9%
Irish
93.4
/100
|
#112
Exceptional
14.9%
Belgians
93.3
/100
|
#113
Exceptional
14.9%
Sri Lankans
93.2
/100
|
#114
Exceptional
14.9%
Immigrants | Ukraine
93.1
/100
|
#115
Exceptional
14.9%
Carpatho Rusyns
93.1
/100
|
#116
Exceptional
14.9%
Immigrants | Norway
92.8
/100
|
#117
Exceptional
15.0%
Immigrants | Malaysia
92.6
/100
|
#118
Exceptional
15.0%
Scottish
92.3
/100
|
#119
Exceptional
15.0%
South Africans
92.1
/100
|
#120
Exceptional
15.0%
Immigrants | Zimbabwe
92.1
/100
|
#121
Exceptional
15.0%
Pakistanis
91.7
/100
|
#122
Exceptional
15.0%
Immigrants | Brazil
91.1
/100
|
#123
Exceptional
15.1%
Czechoslovakians
91.0
/100
|
#124
Exceptional
15.1%

Demographics Similar to West Indians by Child Poverty Under the Age of 16

In terms of child poverty under the age of 16, the demographic groups most similar to West Indians are Immigrants from St. Vincent and the Grenadines (20.1%, a difference of 0.060%), Immigrants from Zaire (20.1%, a difference of 0.14%), Immigrants from West Indies (20.2%, a difference of 0.20%), Blackfeet (20.2%, a difference of 0.32%), and Barbadian (20.0%, a difference of 0.37%).
DemographicsRating | RankChild Poverty Under the Age of 16
Iroquois
0.1
/100
|
#277
Tragic
19.9%
Bangladeshis
0.0
/100
|
#278
Tragic
19.9%
Sub-Saharan Africans
0.0
/100
|
#279
Tragic
19.9%
Comanche
0.0
/100
|
#280
Tragic
19.9%
Central Americans
0.0
/100
|
#281
Tragic
20.0%
Barbadians
0.0
/100
|
#282
Tragic
20.0%
Immigrants | Zaire
0.0
/100
|
#283
Tragic
20.1%
West Indians
0.0
/100
|
#284
Tragic
20.1%
Immigrants | St. Vincent and the Grenadines
0.0
/100
|
#285
Tragic
20.1%
Immigrants | West Indies
0.0
/100
|
#286
Tragic
20.2%
Blackfeet
0.0
/100
|
#287
Tragic
20.2%
Immigrants | Belize
0.0
/100
|
#288
Tragic
20.3%
Senegalese
0.0
/100
|
#289
Tragic
20.4%
Yaqui
0.0
/100
|
#290
Tragic
20.4%
Chippewa
0.0
/100
|
#291
Tragic
20.5%