Immigrants from North Macedonia vs Immigrants from Grenada Child Poverty Among Boys Under 16
COMPARE
Immigrants from North Macedonia
Immigrants from Grenada
Child Poverty Among Boys Under 16
Child Poverty Among Boys Under 16 Comparison
Immigrants from North Macedonia
Immigrants from Grenada
14.9%
CHILD POVERTY AMONG BOYS UNDER 16
96.3/ 100
METRIC RATING
96th/ 347
METRIC RANK
21.3%
CHILD POVERTY AMONG BOYS UNDER 16
0.0/ 100
METRIC RATING
306th/ 347
METRIC RANK
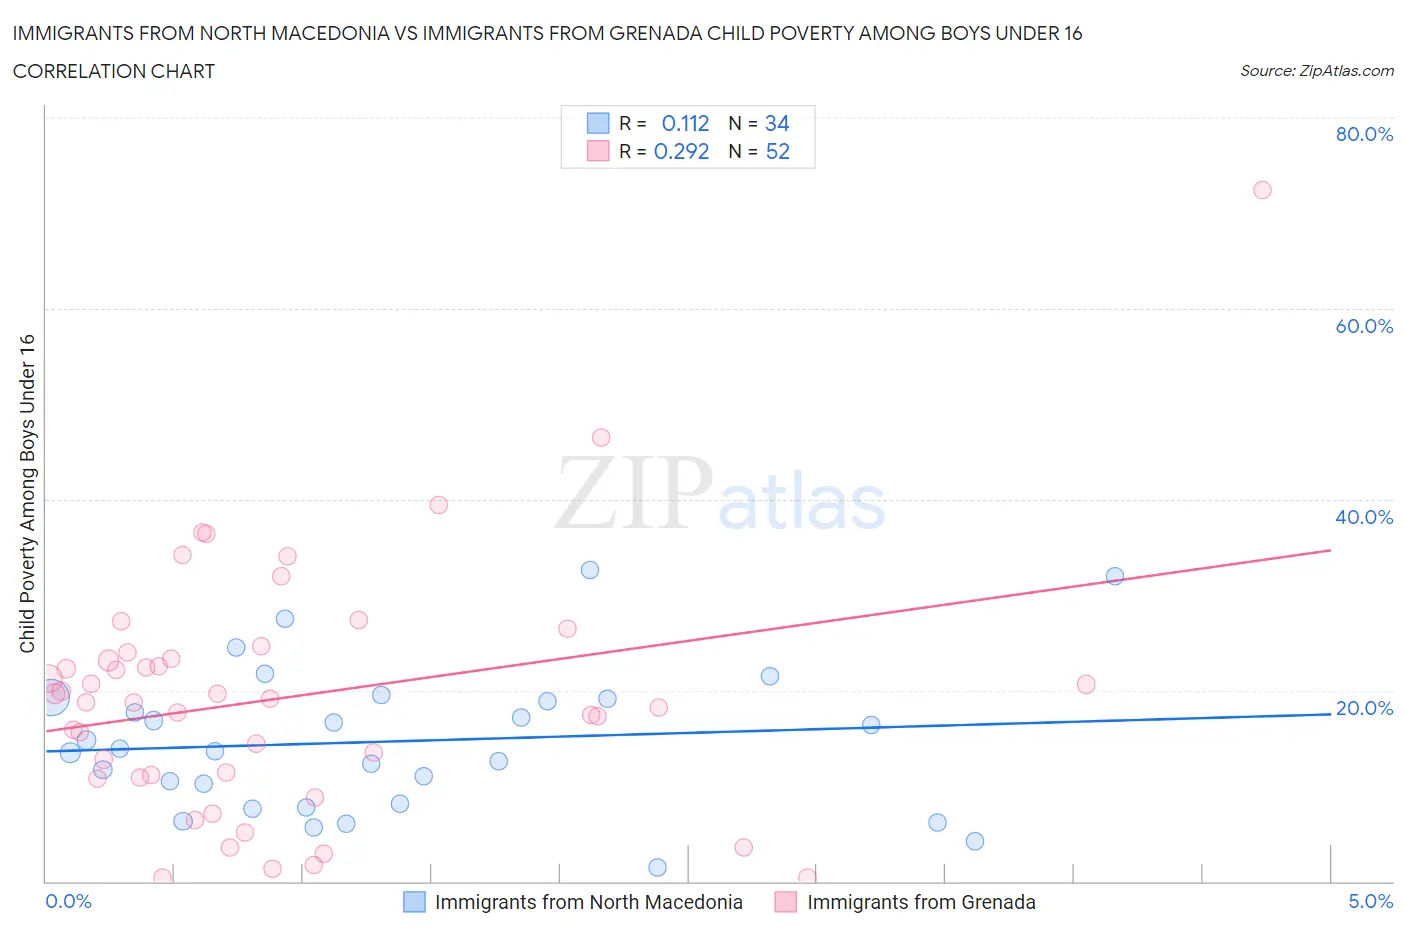
Immigrants from North Macedonia vs Immigrants from Grenada Child Poverty Among Boys Under 16 Correlation Chart
The statistical analysis conducted on geographies consisting of 73,631,017 people shows a poor positive correlation between the proportion of Immigrants from North Macedonia and poverty level among boys under the age of 16 in the United States with a correlation coefficient (R) of 0.112 and weighted average of 14.9%. Similarly, the statistical analysis conducted on geographies consisting of 66,992,189 people shows a weak positive correlation between the proportion of Immigrants from Grenada and poverty level among boys under the age of 16 in the United States with a correlation coefficient (R) of 0.292 and weighted average of 21.3%, a difference of 42.6%.
Child Poverty Among Boys Under 16 Correlation Summary
| Measurement | Immigrants from North Macedonia | Immigrants from Grenada |
| Minimum | 1.4% | 0.35% |
| Maximum | 32.7% | 72.4% |
| Range | 31.2% | 72.1% |
| Mean | 14.7% | 19.3% |
| Median | 13.7% | 18.9% |
| Interquartile 25% (IQ1) | 8.1% | 11.0% |
| Interquartile 75% (IQ3) | 19.1% | 23.6% |
| Interquartile Range (IQR) | 11.0% | 12.6% |
| Standard Deviation (Sample) | 7.6% | 13.0% |
| Standard Deviation (Population) | 7.4% | 12.9% |
Similar Demographics by Child Poverty Among Boys Under 16
Demographics Similar to Immigrants from North Macedonia by Child Poverty Among Boys Under 16
In terms of child poverty among boys under 16, the demographic groups most similar to Immigrants from North Macedonia are Immigrants from Egypt (14.9%, a difference of 0.010%), British (15.0%, a difference of 0.050%), Immigrants from France (15.0%, a difference of 0.15%), Finnish (14.9%, a difference of 0.25%), and Sri Lankan (14.9%, a difference of 0.36%).
| Demographics | Rating | Rank | Child Poverty Among Boys Under 16 |
| Immigrants | Argentina | 97.1 /100 | #89 | Exceptional 14.8% |
| Austrians | 97.1 /100 | #90 | Exceptional 14.8% |
| Paraguayans | 96.8 /100 | #91 | Exceptional 14.9% |
| Argentineans | 96.7 /100 | #92 | Exceptional 14.9% |
| Sri Lankans | 96.7 /100 | #93 | Exceptional 14.9% |
| Immigrants | Italy | 96.7 /100 | #94 | Exceptional 14.9% |
| Finns | 96.5 /100 | #95 | Exceptional 14.9% |
| Immigrants | North Macedonia | 96.3 /100 | #96 | Exceptional 14.9% |
| Immigrants | Egypt | 96.2 /100 | #97 | Exceptional 14.9% |
| British | 96.2 /100 | #98 | Exceptional 15.0% |
| Immigrants | France | 96.1 /100 | #99 | Exceptional 15.0% |
| Chileans | 95.8 /100 | #100 | Exceptional 15.0% |
| Immigrants | Belarus | 95.7 /100 | #101 | Exceptional 15.0% |
| Romanians | 95.6 /100 | #102 | Exceptional 15.0% |
| Immigrants | Denmark | 95.6 /100 | #103 | Exceptional 15.0% |
Demographics Similar to Immigrants from Grenada by Child Poverty Among Boys Under 16
In terms of child poverty among boys under 16, the demographic groups most similar to Immigrants from Grenada are Kiowa (21.3%, a difference of 0.010%), Choctaw (21.3%, a difference of 0.090%), Immigrants from Central America (21.3%, a difference of 0.18%), Immigrants from Haiti (21.3%, a difference of 0.24%), and Guatemalan (21.1%, a difference of 0.78%).
| Demographics | Rating | Rank | Child Poverty Among Boys Under 16 |
| Immigrants | Caribbean | 0.0 /100 | #299 | Tragic 21.0% |
| Haitians | 0.0 /100 | #300 | Tragic 21.0% |
| Guatemalans | 0.0 /100 | #301 | Tragic 21.1% |
| Somalis | 0.0 /100 | #302 | Tragic 21.1% |
| Immigrants | Haiti | 0.0 /100 | #303 | Tragic 21.3% |
| Immigrants | Central America | 0.0 /100 | #304 | Tragic 21.3% |
| Kiowa | 0.0 /100 | #305 | Tragic 21.3% |
| Immigrants | Grenada | 0.0 /100 | #306 | Tragic 21.3% |
| Choctaw | 0.0 /100 | #307 | Tragic 21.3% |
| Immigrants | Mexico | 0.0 /100 | #308 | Tragic 21.5% |
| Seminole | 0.0 /100 | #309 | Tragic 21.5% |
| Creek | 0.0 /100 | #310 | Tragic 21.5% |
| Bahamians | 0.0 /100 | #311 | Tragic 21.6% |
| Immigrants | Guatemala | 0.0 /100 | #312 | Tragic 21.6% |
| British West Indians | 0.0 /100 | #313 | Tragic 21.6% |