Immigrants from North America vs Immigrants from Serbia Single Mother Poverty
COMPARE
Immigrants from North America
Immigrants from Serbia
Single Mother Poverty
Single Mother Poverty Comparison
Immigrants from North America
Immigrants from Serbia
28.5%
SINGLE MOTHER POVERTY
86.5/ 100
METRIC RATING
143rd/ 347
METRIC RANK
26.9%
SINGLE MOTHER POVERTY
99.9/ 100
METRIC RATING
46th/ 347
METRIC RANK
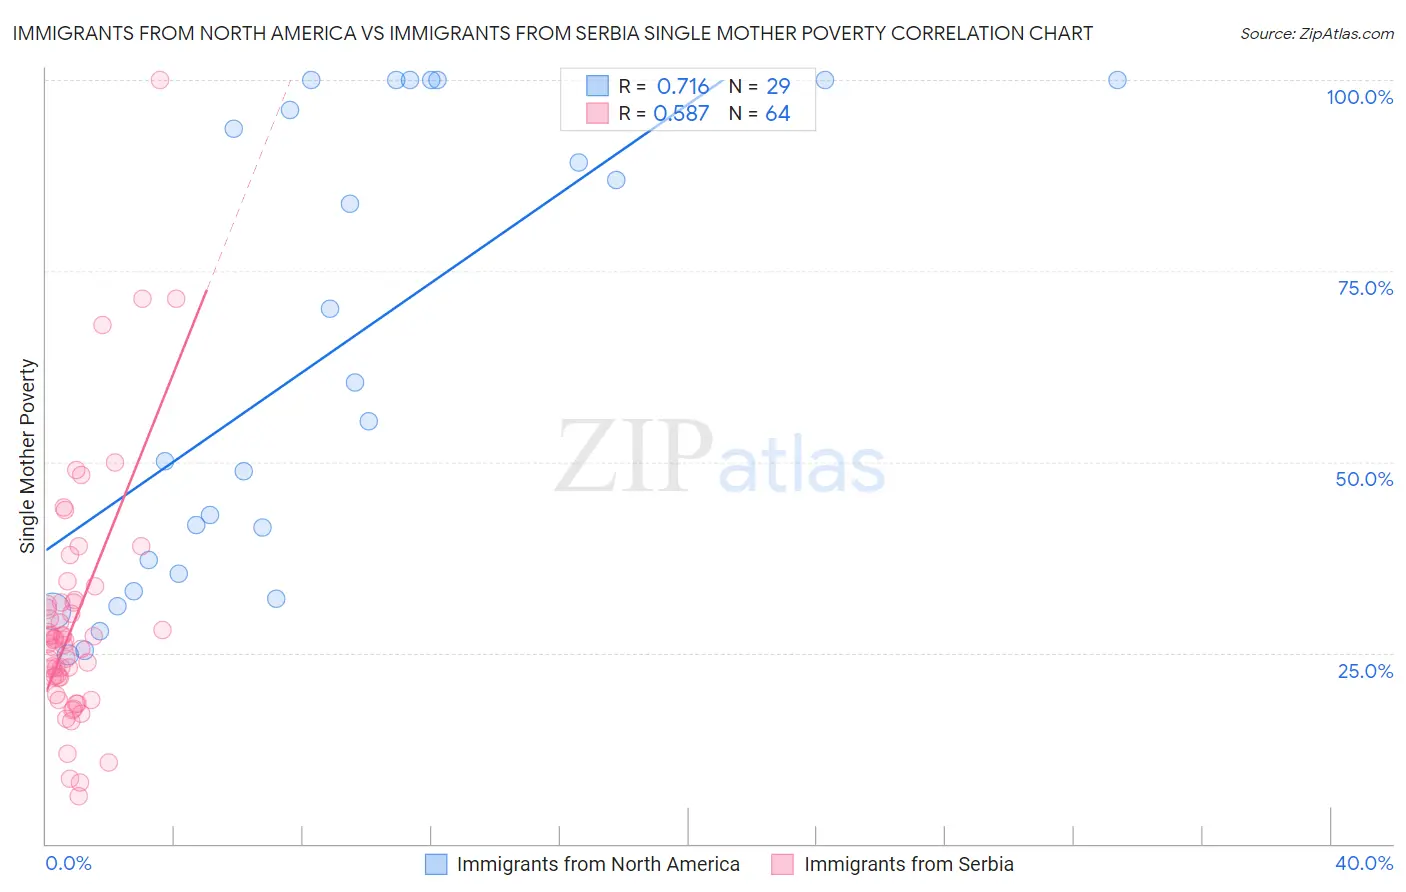
Immigrants from North America vs Immigrants from Serbia Single Mother Poverty Correlation Chart
The statistical analysis conducted on geographies consisting of 446,488,890 people shows a strong positive correlation between the proportion of Immigrants from North America and poverty level among single mothers in the United States with a correlation coefficient (R) of 0.716 and weighted average of 28.5%. Similarly, the statistical analysis conducted on geographies consisting of 130,174,648 people shows a substantial positive correlation between the proportion of Immigrants from Serbia and poverty level among single mothers in the United States with a correlation coefficient (R) of 0.587 and weighted average of 26.9%, a difference of 6.0%.
Single Mother Poverty Correlation Summary
| Measurement | Immigrants from North America | Immigrants from Serbia |
| Minimum | 24.7% | 6.2% |
| Maximum | 100.0% | 100.0% |
| Range | 75.3% | 93.8% |
| Mean | 63.4% | 29.2% |
| Median | 55.4% | 26.4% |
| Interquartile 25% (IQ1) | 34.3% | 21.8% |
| Interquartile 75% (IQ3) | 98.0% | 31.6% |
| Interquartile Range (IQR) | 63.8% | 9.8% |
| Standard Deviation (Sample) | 29.6% | 15.9% |
| Standard Deviation (Population) | 29.1% | 15.8% |
Similar Demographics by Single Mother Poverty
Demographics Similar to Immigrants from North America by Single Mother Poverty
In terms of single mother poverty, the demographic groups most similar to Immigrants from North America are South African (28.5%, a difference of 0.010%), Luxembourger (28.5%, a difference of 0.010%), Immigrants from South America (28.5%, a difference of 0.040%), Immigrants from Denmark (28.5%, a difference of 0.050%), and Danish (28.5%, a difference of 0.060%).
| Demographics | Rating | Rank | Single Mother Poverty |
| Native Hawaiians | 88.9 /100 | #136 | Excellent 28.4% |
| Immigrants | Canada | 88.9 /100 | #137 | Excellent 28.4% |
| Immigrants | Belgium | 88.5 /100 | #138 | Excellent 28.5% |
| Samoans | 88.1 /100 | #139 | Excellent 28.5% |
| Immigrants | Colombia | 88.0 /100 | #140 | Excellent 28.5% |
| Danes | 87.1 /100 | #141 | Excellent 28.5% |
| South Africans | 86.6 /100 | #142 | Excellent 28.5% |
| Immigrants | North America | 86.5 /100 | #143 | Excellent 28.5% |
| Luxembourgers | 86.4 /100 | #144 | Excellent 28.5% |
| Immigrants | South America | 86.1 /100 | #145 | Excellent 28.5% |
| Immigrants | Denmark | 86.1 /100 | #146 | Excellent 28.5% |
| Immigrants | Lebanon | 85.3 /100 | #147 | Excellent 28.6% |
| Syrians | 85.3 /100 | #148 | Excellent 28.6% |
| Serbians | 85.0 /100 | #149 | Excellent 28.6% |
| Northern Europeans | 81.7 /100 | #150 | Excellent 28.6% |
Demographics Similar to Immigrants from Serbia by Single Mother Poverty
In terms of single mother poverty, the demographic groups most similar to Immigrants from Serbia are Latvian (26.9%, a difference of 0.040%), Egyptian (26.9%, a difference of 0.060%), Immigrants from Sierra Leone (26.9%, a difference of 0.12%), Immigrants from Poland (26.9%, a difference of 0.13%), and Cambodian (27.0%, a difference of 0.22%).
| Demographics | Rating | Rank | Single Mother Poverty |
| Sri Lankans | 99.9 /100 | #39 | Exceptional 26.7% |
| Immigrants | Vietnam | 99.9 /100 | #40 | Exceptional 26.7% |
| Immigrants | Greece | 99.9 /100 | #41 | Exceptional 26.7% |
| Armenians | 99.9 /100 | #42 | Exceptional 26.8% |
| Tsimshian | 99.9 /100 | #43 | Exceptional 26.8% |
| Immigrants | Sierra Leone | 99.9 /100 | #44 | Exceptional 26.9% |
| Latvians | 99.9 /100 | #45 | Exceptional 26.9% |
| Immigrants | Serbia | 99.9 /100 | #46 | Exceptional 26.9% |
| Egyptians | 99.8 /100 | #47 | Exceptional 26.9% |
| Immigrants | Poland | 99.8 /100 | #48 | Exceptional 26.9% |
| Cambodians | 99.8 /100 | #49 | Exceptional 27.0% |
| Laotians | 99.8 /100 | #50 | Exceptional 27.0% |
| Immigrants | Argentina | 99.7 /100 | #51 | Exceptional 27.1% |
| Immigrants | South Eastern Asia | 99.7 /100 | #52 | Exceptional 27.1% |
| Immigrants | Jordan | 99.7 /100 | #53 | Exceptional 27.1% |