Immigrants from Jordan vs Immigrants from Serbia Single Mother Poverty
COMPARE
Immigrants from Jordan
Immigrants from Serbia
Single Mother Poverty
Single Mother Poverty Comparison
Immigrants from Jordan
Immigrants from Serbia
27.1%
SINGLE MOTHER POVERTY
99.7/ 100
METRIC RATING
53rd/ 347
METRIC RANK
26.9%
SINGLE MOTHER POVERTY
99.9/ 100
METRIC RATING
46th/ 347
METRIC RANK
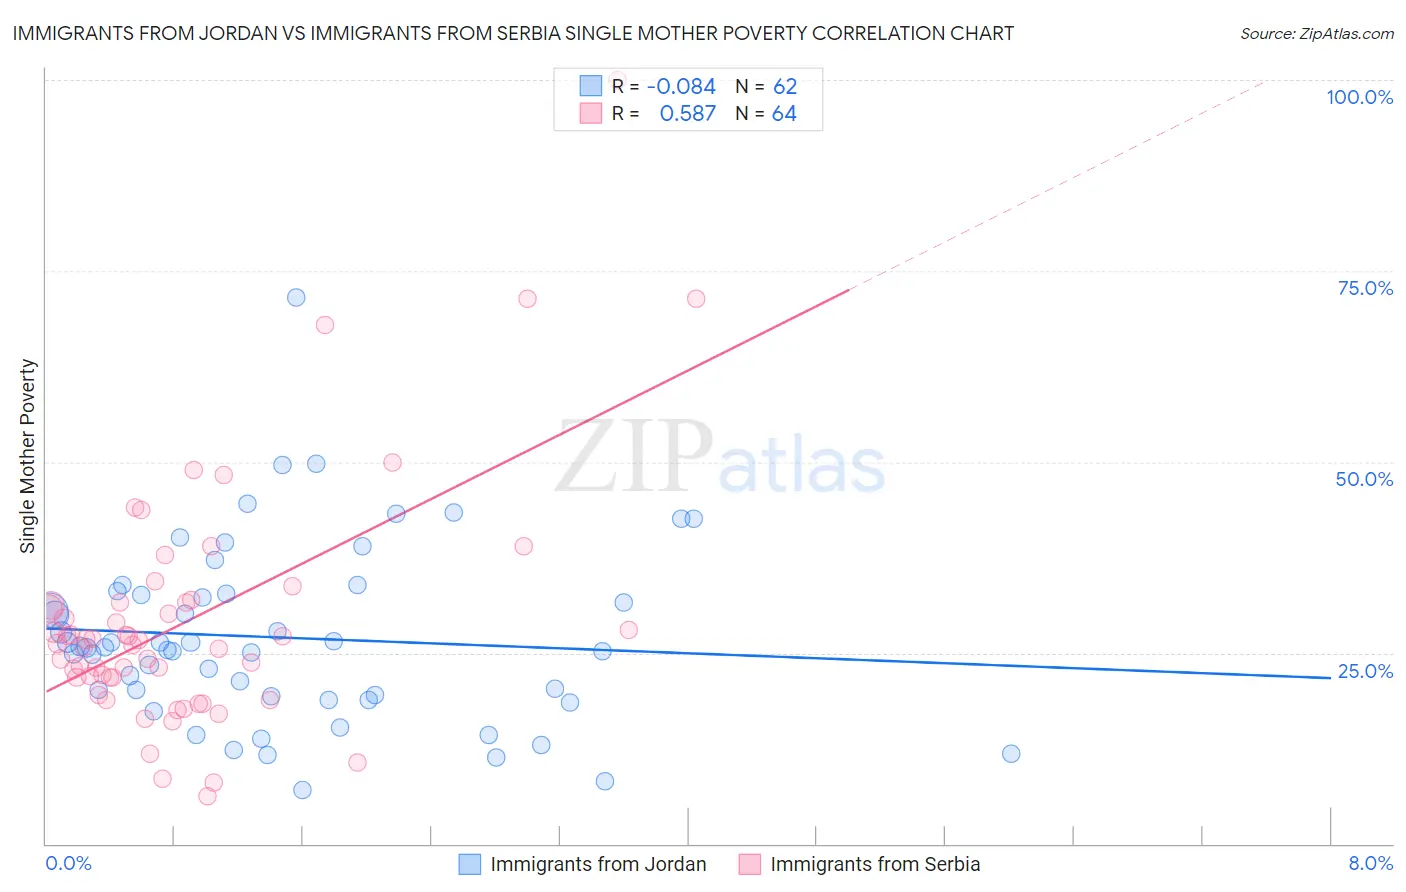
Immigrants from Jordan vs Immigrants from Serbia Single Mother Poverty Correlation Chart
The statistical analysis conducted on geographies consisting of 179,287,213 people shows a slight negative correlation between the proportion of Immigrants from Jordan and poverty level among single mothers in the United States with a correlation coefficient (R) of -0.084 and weighted average of 27.1%. Similarly, the statistical analysis conducted on geographies consisting of 130,174,648 people shows a substantial positive correlation between the proportion of Immigrants from Serbia and poverty level among single mothers in the United States with a correlation coefficient (R) of 0.587 and weighted average of 26.9%, a difference of 0.85%.
Single Mother Poverty Correlation Summary
| Measurement | Immigrants from Jordan | Immigrants from Serbia |
| Minimum | 7.0% | 6.2% |
| Maximum | 71.6% | 100.0% |
| Range | 64.5% | 93.8% |
| Mean | 27.0% | 29.2% |
| Median | 25.6% | 26.4% |
| Interquartile 25% (IQ1) | 19.4% | 21.8% |
| Interquartile 75% (IQ3) | 32.7% | 31.6% |
| Interquartile Range (IQR) | 13.3% | 9.8% |
| Standard Deviation (Sample) | 11.7% | 15.9% |
| Standard Deviation (Population) | 11.6% | 15.8% |
Demographics Similar to Immigrants from Jordan and Immigrants from Serbia by Single Mother Poverty
In terms of single mother poverty, the demographic groups most similar to Immigrants from Jordan are Immigrants from Bulgaria (27.1%, a difference of 0.030%), Immigrants from South Eastern Asia (27.1%, a difference of 0.040%), Immigrants from Egypt (27.1%, a difference of 0.060%), Immigrants from Argentina (27.1%, a difference of 0.080%), and Immigrants from Romania (27.2%, a difference of 0.11%). Similarly, the demographic groups most similar to Immigrants from Serbia are Latvian (26.9%, a difference of 0.040%), Egyptian (26.9%, a difference of 0.060%), Immigrants from Sierra Leone (26.9%, a difference of 0.12%), Immigrants from Poland (26.9%, a difference of 0.13%), and Cambodian (27.0%, a difference of 0.22%).
| Demographics | Rating | Rank | Single Mother Poverty |
| Sri Lankans | 99.9 /100 | #39 | Exceptional 26.7% |
| Immigrants | Vietnam | 99.9 /100 | #40 | Exceptional 26.7% |
| Immigrants | Greece | 99.9 /100 | #41 | Exceptional 26.7% |
| Armenians | 99.9 /100 | #42 | Exceptional 26.8% |
| Tsimshian | 99.9 /100 | #43 | Exceptional 26.8% |
| Immigrants | Sierra Leone | 99.9 /100 | #44 | Exceptional 26.9% |
| Latvians | 99.9 /100 | #45 | Exceptional 26.9% |
| Immigrants | Serbia | 99.9 /100 | #46 | Exceptional 26.9% |
| Egyptians | 99.8 /100 | #47 | Exceptional 26.9% |
| Immigrants | Poland | 99.8 /100 | #48 | Exceptional 26.9% |
| Cambodians | 99.8 /100 | #49 | Exceptional 27.0% |
| Laotians | 99.8 /100 | #50 | Exceptional 27.0% |
| Immigrants | Argentina | 99.7 /100 | #51 | Exceptional 27.1% |
| Immigrants | South Eastern Asia | 99.7 /100 | #52 | Exceptional 27.1% |
| Immigrants | Jordan | 99.7 /100 | #53 | Exceptional 27.1% |
| Immigrants | Bulgaria | 99.7 /100 | #54 | Exceptional 27.1% |
| Immigrants | Egypt | 99.7 /100 | #55 | Exceptional 27.1% |
| Immigrants | Romania | 99.7 /100 | #56 | Exceptional 27.2% |
| Palestinians | 99.7 /100 | #57 | Exceptional 27.2% |
| Argentineans | 99.6 /100 | #58 | Exceptional 27.2% |
| Paraguayans | 99.6 /100 | #59 | Exceptional 27.2% |