Immigrants from St. Vincent and the Grenadines vs Immigrants from Indonesia Male Poverty
COMPARE
Immigrants from St. Vincent and the Grenadines
Immigrants from Indonesia
Male Poverty
Male Poverty Comparison
Immigrants from St. Vincent and the Grenadines
Immigrants from Indonesia
13.8%
MALE POVERTY
0.0/ 100
METRIC RATING
288th/ 347
METRIC RANK
10.5%
MALE POVERTY
93.3/ 100
METRIC RATING
99th/ 347
METRIC RANK
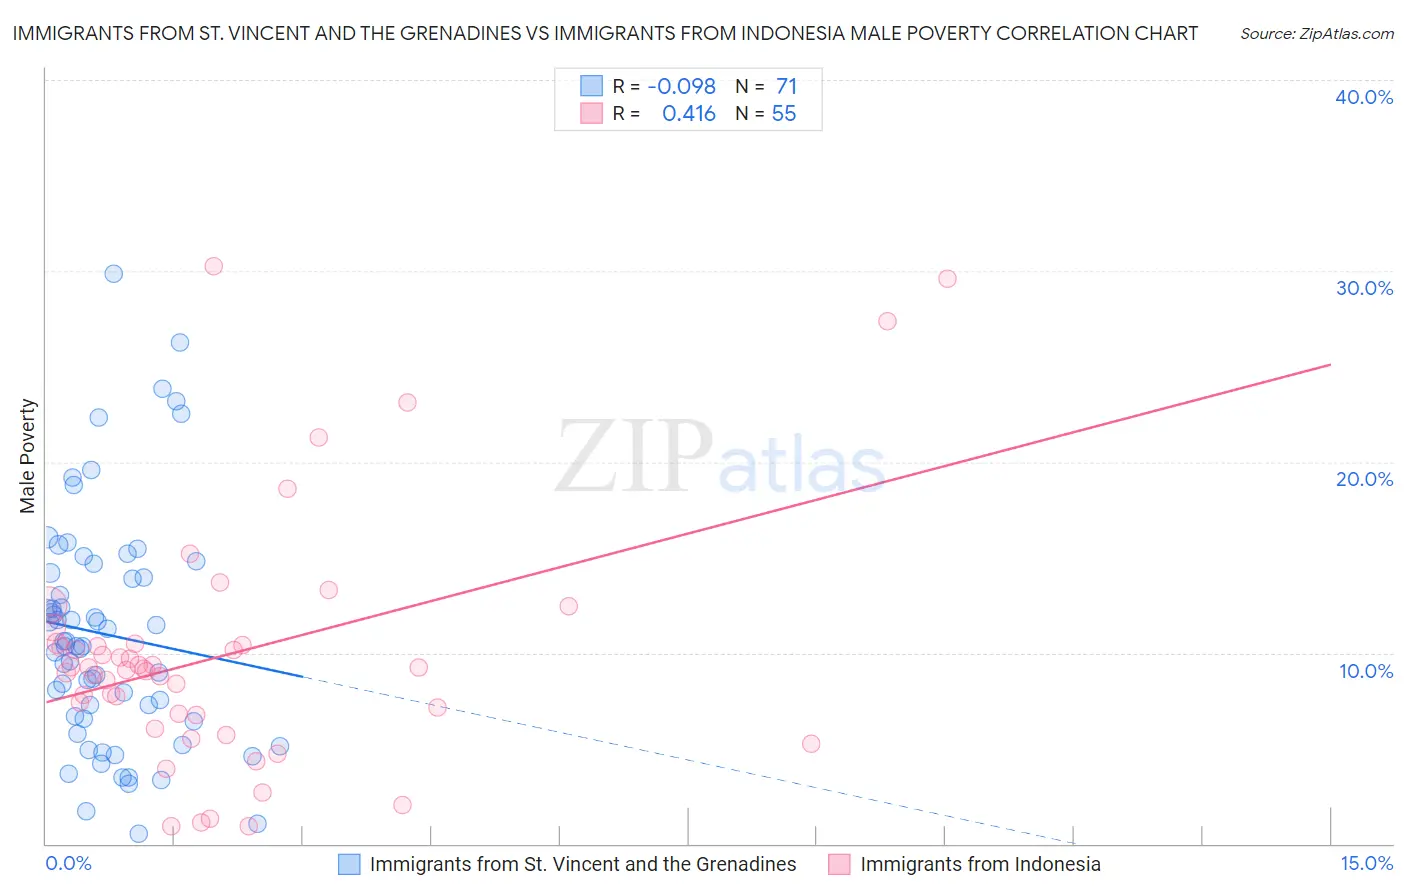
Immigrants from St. Vincent and the Grenadines vs Immigrants from Indonesia Male Poverty Correlation Chart
The statistical analysis conducted on geographies consisting of 56,096,349 people shows a slight negative correlation between the proportion of Immigrants from St. Vincent and the Grenadines and poverty level among males in the United States with a correlation coefficient (R) of -0.098 and weighted average of 13.8%. Similarly, the statistical analysis conducted on geographies consisting of 215,697,022 people shows a moderate positive correlation between the proportion of Immigrants from Indonesia and poverty level among males in the United States with a correlation coefficient (R) of 0.416 and weighted average of 10.5%, a difference of 31.7%.
Male Poverty Correlation Summary
| Measurement | Immigrants from St. Vincent and the Grenadines | Immigrants from Indonesia |
| Minimum | 0.49% | 0.89% |
| Maximum | 29.9% | 30.3% |
| Range | 29.4% | 29.4% |
| Mean | 11.0% | 9.9% |
| Median | 10.4% | 9.2% |
| Interquartile 25% (IQ1) | 6.6% | 6.8% |
| Interquartile 75% (IQ3) | 14.2% | 10.5% |
| Interquartile Range (IQR) | 7.6% | 3.7% |
| Standard Deviation (Sample) | 6.1% | 6.4% |
| Standard Deviation (Population) | 6.0% | 6.3% |
Similar Demographics by Male Poverty
Demographics Similar to Immigrants from St. Vincent and the Grenadines by Male Poverty
In terms of male poverty, the demographic groups most similar to Immigrants from St. Vincent and the Grenadines are Immigrants from Barbados (13.8%, a difference of 0.17%), Guatemalan (13.8%, a difference of 0.17%), Shoshone (13.8%, a difference of 0.18%), Immigrants from Zaire (13.8%, a difference of 0.18%), and West Indian (13.8%, a difference of 0.22%).
| Demographics | Rating | Rank | Male Poverty |
| Yaqui | 0.0 /100 | #281 | Tragic 13.7% |
| Immigrants | Cabo Verde | 0.0 /100 | #282 | Tragic 13.7% |
| Comanche | 0.0 /100 | #283 | Tragic 13.8% |
| Immigrants | Haiti | 0.0 /100 | #284 | Tragic 13.8% |
| West Indians | 0.0 /100 | #285 | Tragic 13.8% |
| Shoshone | 0.0 /100 | #286 | Tragic 13.8% |
| Immigrants | Barbados | 0.0 /100 | #287 | Tragic 13.8% |
| Immigrants | St. Vincent and the Grenadines | 0.0 /100 | #288 | Tragic 13.8% |
| Guatemalans | 0.0 /100 | #289 | Tragic 13.8% |
| Immigrants | Zaire | 0.0 /100 | #290 | Tragic 13.8% |
| Vietnamese | 0.0 /100 | #291 | Tragic 13.8% |
| Indonesians | 0.0 /100 | #292 | Tragic 13.8% |
| Immigrants | Belize | 0.0 /100 | #293 | Tragic 13.8% |
| Hispanics or Latinos | 0.0 /100 | #294 | Tragic 13.9% |
| Immigrants | Central America | 0.0 /100 | #295 | Tragic 13.9% |
Demographics Similar to Immigrants from Indonesia by Male Poverty
In terms of male poverty, the demographic groups most similar to Immigrants from Indonesia are Finnish (10.5%, a difference of 0.060%), Romanian (10.5%, a difference of 0.13%), Immigrants from Egypt (10.4%, a difference of 0.18%), Immigrants from Latvia (10.5%, a difference of 0.21%), and Scottish (10.4%, a difference of 0.31%).
| Demographics | Rating | Rank | Male Poverty |
| Jordanians | 94.4 /100 | #92 | Exceptional 10.4% |
| Australians | 94.4 /100 | #93 | Exceptional 10.4% |
| Immigrants | South Africa | 94.1 /100 | #94 | Exceptional 10.4% |
| Scottish | 94.0 /100 | #95 | Exceptional 10.4% |
| Immigrants | Egypt | 93.7 /100 | #96 | Exceptional 10.4% |
| Romanians | 93.6 /100 | #97 | Exceptional 10.5% |
| Finns | 93.4 /100 | #98 | Exceptional 10.5% |
| Immigrants | Indonesia | 93.3 /100 | #99 | Exceptional 10.5% |
| Immigrants | Latvia | 92.8 /100 | #100 | Exceptional 10.5% |
| Immigrants | Zimbabwe | 92.0 /100 | #101 | Exceptional 10.5% |
| French Canadians | 91.9 /100 | #102 | Exceptional 10.5% |
| Slavs | 91.7 /100 | #103 | Exceptional 10.5% |
| Welsh | 91.6 /100 | #104 | Exceptional 10.5% |
| Canadians | 91.6 /100 | #105 | Exceptional 10.5% |
| Immigrants | Southern Europe | 91.3 /100 | #106 | Exceptional 10.5% |