Immigrants from Nicaragua vs Immigrants from Ireland Male Poverty
COMPARE
Immigrants from Nicaragua
Immigrants from Ireland
Male Poverty
Male Poverty Comparison
Immigrants from Nicaragua
Immigrants from Ireland
12.9%
MALE POVERTY
0.2/ 100
METRIC RATING
250th/ 347
METRIC RANK
9.1%
MALE POVERTY
99.9/ 100
METRIC RATING
7th/ 347
METRIC RANK
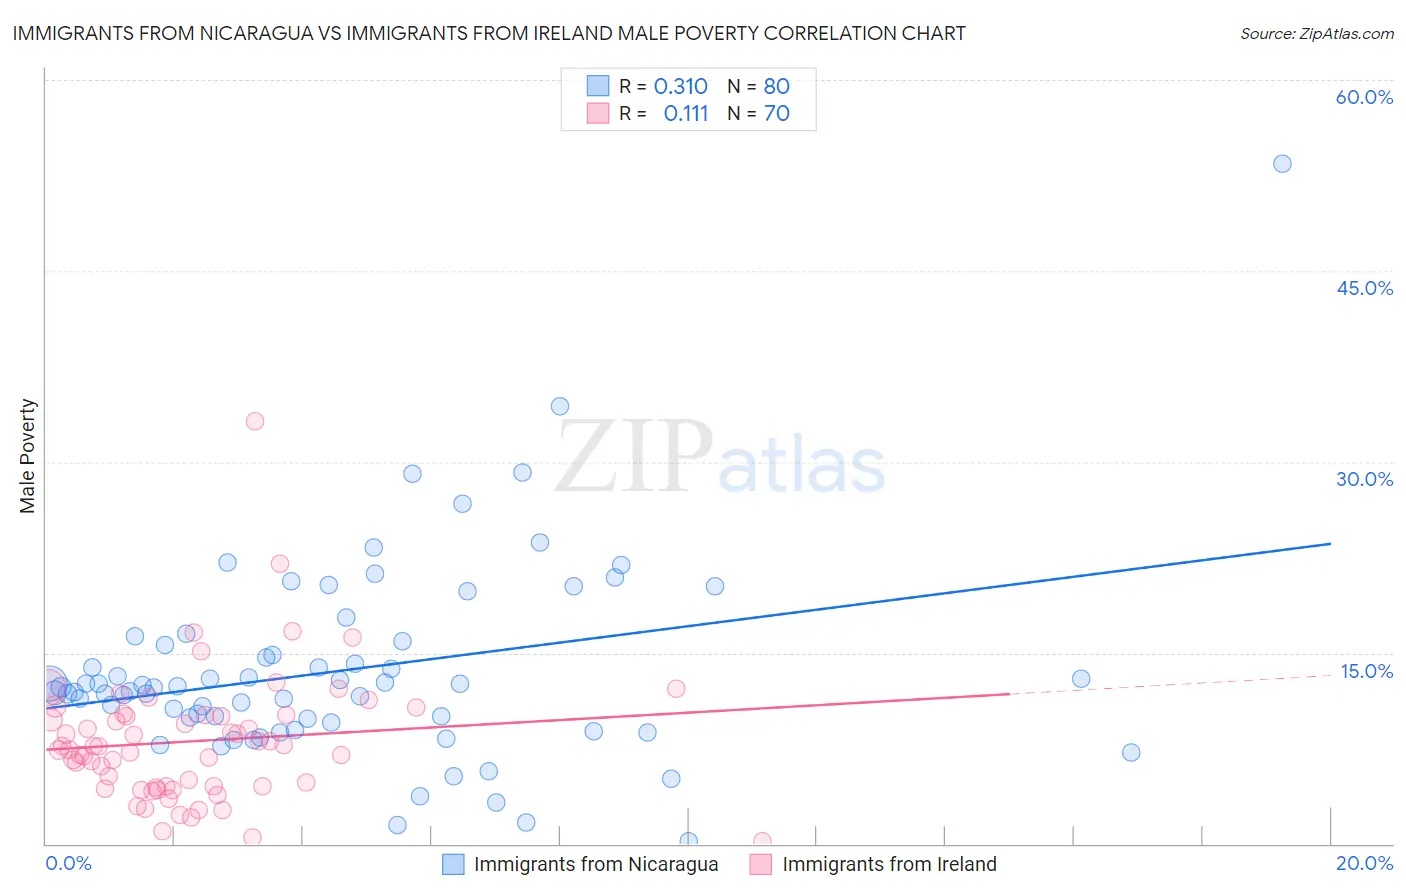
Immigrants from Nicaragua vs Immigrants from Ireland Male Poverty Correlation Chart
The statistical analysis conducted on geographies consisting of 236,310,825 people shows a mild positive correlation between the proportion of Immigrants from Nicaragua and poverty level among males in the United States with a correlation coefficient (R) of 0.310 and weighted average of 12.9%. Similarly, the statistical analysis conducted on geographies consisting of 240,683,181 people shows a poor positive correlation between the proportion of Immigrants from Ireland and poverty level among males in the United States with a correlation coefficient (R) of 0.111 and weighted average of 9.1%, a difference of 41.2%.
Male Poverty Correlation Summary
| Measurement | Immigrants from Nicaragua | Immigrants from Ireland |
| Minimum | 0.19% | 0.22% |
| Maximum | 53.4% | 33.2% |
| Range | 53.2% | 33.0% |
| Mean | 13.6% | 8.1% |
| Median | 12.3% | 7.5% |
| Interquartile 25% (IQ1) | 9.7% | 4.5% |
| Interquartile 75% (IQ3) | 15.8% | 10.1% |
| Interquartile Range (IQR) | 6.1% | 5.6% |
| Standard Deviation (Sample) | 7.7% | 5.1% |
| Standard Deviation (Population) | 7.7% | 5.1% |
Similar Demographics by Male Poverty
Demographics Similar to Immigrants from Nicaragua by Male Poverty
In terms of male poverty, the demographic groups most similar to Immigrants from Nicaragua are Potawatomi (12.9%, a difference of 0.010%), Immigrants from Sudan (12.9%, a difference of 0.080%), Immigrants from Cuba (12.9%, a difference of 0.10%), Immigrants from Ecuador (12.9%, a difference of 0.13%), and Immigrants from Western Africa (12.9%, a difference of 0.14%).
| Demographics | Rating | Rank | Male Poverty |
| Alaskan Athabascans | 0.3 /100 | #243 | Tragic 12.8% |
| Tsimshian | 0.3 /100 | #244 | Tragic 12.8% |
| Liberians | 0.3 /100 | #245 | Tragic 12.8% |
| Immigrants | El Salvador | 0.2 /100 | #246 | Tragic 12.8% |
| Immigrants | Western Africa | 0.2 /100 | #247 | Tragic 12.9% |
| Immigrants | Sudan | 0.2 /100 | #248 | Tragic 12.9% |
| Potawatomi | 0.2 /100 | #249 | Tragic 12.9% |
| Immigrants | Nicaragua | 0.2 /100 | #250 | Tragic 12.9% |
| Immigrants | Cuba | 0.2 /100 | #251 | Tragic 12.9% |
| Immigrants | Ecuador | 0.2 /100 | #252 | Tragic 12.9% |
| Immigrants | Ghana | 0.2 /100 | #253 | Tragic 12.9% |
| Mexican American Indians | 0.1 /100 | #254 | Tragic 13.0% |
| Immigrants | Liberia | 0.1 /100 | #255 | Tragic 13.0% |
| Immigrants | Burma/Myanmar | 0.1 /100 | #256 | Tragic 13.0% |
| Immigrants | Trinidad and Tobago | 0.1 /100 | #257 | Tragic 13.1% |
Demographics Similar to Immigrants from Ireland by Male Poverty
In terms of male poverty, the demographic groups most similar to Immigrants from Ireland are Assyrian/Chaldean/Syriac (9.1%, a difference of 0.080%), Filipino (9.2%, a difference of 0.67%), Maltese (9.1%, a difference of 0.75%), Immigrants from South Central Asia (9.3%, a difference of 1.5%), and Bulgarian (9.3%, a difference of 2.0%).
| Demographics | Rating | Rank | Male Poverty |
| Immigrants | India | 100.0 /100 | #1 | Exceptional 8.2% |
| Chinese | 100.0 /100 | #2 | Exceptional 8.7% |
| Thais | 100.0 /100 | #3 | Exceptional 8.7% |
| Immigrants | Taiwan | 100.0 /100 | #4 | Exceptional 8.9% |
| Maltese | 100.0 /100 | #5 | Exceptional 9.1% |
| Assyrians/Chaldeans/Syriacs | 99.9 /100 | #6 | Exceptional 9.1% |
| Immigrants | Ireland | 99.9 /100 | #7 | Exceptional 9.1% |
| Filipinos | 99.9 /100 | #8 | Exceptional 9.2% |
| Immigrants | South Central Asia | 99.9 /100 | #9 | Exceptional 9.3% |
| Bulgarians | 99.9 /100 | #10 | Exceptional 9.3% |
| Bolivians | 99.9 /100 | #11 | Exceptional 9.4% |
| Immigrants | Bolivia | 99.9 /100 | #12 | Exceptional 9.4% |
| Immigrants | Lithuania | 99.9 /100 | #13 | Exceptional 9.4% |
| Immigrants | North Macedonia | 99.8 /100 | #14 | Exceptional 9.4% |
| Bhutanese | 99.8 /100 | #15 | Exceptional 9.5% |