Immigrants from Nepal vs Polish Single Female Poverty
COMPARE
Immigrants from Nepal
Polish
Single Female Poverty
Single Female Poverty Comparison
Immigrants from Nepal
Poles
20.3%
SINGLE FEMALE POVERTY
90.6/ 100
METRIC RATING
137th/ 347
METRIC RANK
20.0%
SINGLE FEMALE POVERTY
95.6/ 100
METRIC RATING
117th/ 347
METRIC RANK
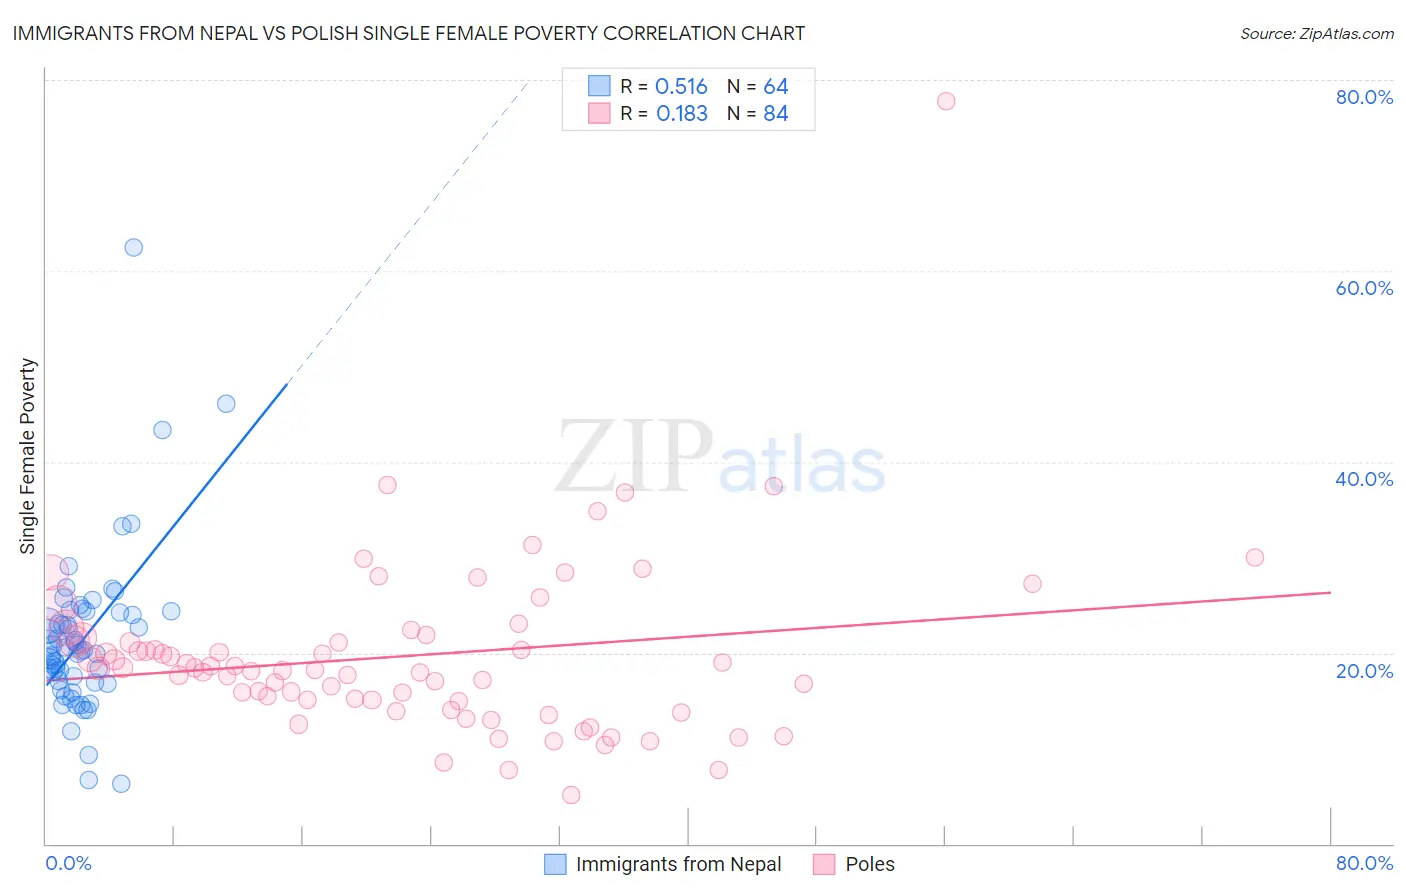
Immigrants from Nepal vs Polish Single Female Poverty Correlation Chart
The statistical analysis conducted on geographies consisting of 185,480,601 people shows a substantial positive correlation between the proportion of Immigrants from Nepal and poverty level among single females in the United States with a correlation coefficient (R) of 0.516 and weighted average of 20.3%. Similarly, the statistical analysis conducted on geographies consisting of 540,648,270 people shows a poor positive correlation between the proportion of Poles and poverty level among single females in the United States with a correlation coefficient (R) of 0.183 and weighted average of 20.0%, a difference of 1.3%.
Single Female Poverty Correlation Summary
| Measurement | Immigrants from Nepal | Polish |
| Minimum | 6.3% | 5.1% |
| Maximum | 62.5% | 77.8% |
| Range | 56.2% | 72.7% |
| Mean | 21.5% | 19.6% |
| Median | 20.5% | 18.3% |
| Interquartile 25% (IQ1) | 17.0% | 15.0% |
| Interquartile 75% (IQ3) | 24.3% | 21.4% |
| Interquartile Range (IQR) | 7.3% | 6.4% |
| Standard Deviation (Sample) | 8.5% | 9.3% |
| Standard Deviation (Population) | 8.5% | 9.3% |
Demographics Similar to Immigrants from Nepal and Poles by Single Female Poverty
In terms of single female poverty, the demographic groups most similar to Immigrants from Nepal are Immigrants from Canada (20.2%, a difference of 0.11%), Immigrants from Iraq (20.2%, a difference of 0.12%), Immigrants from Venezuela (20.2%, a difference of 0.17%), Immigrants from England (20.2%, a difference of 0.26%), and Uruguayan (20.2%, a difference of 0.29%). Similarly, the demographic groups most similar to Poles are Immigrants from Afghanistan (20.0%, a difference of 0.080%), Immigrants from Ethiopia (20.0%, a difference of 0.080%), South American (20.0%, a difference of 0.17%), Immigrants from Switzerland (20.0%, a difference of 0.20%), and Immigrants from South America (20.0%, a difference of 0.23%).
| Demographics | Rating | Rank | Single Female Poverty |
| Poles | 95.6 /100 | #117 | Exceptional 20.0% |
| Immigrants | Afghanistan | 95.4 /100 | #118 | Exceptional 20.0% |
| Immigrants | Ethiopia | 95.4 /100 | #119 | Exceptional 20.0% |
| South Americans | 95.1 /100 | #120 | Exceptional 20.0% |
| Immigrants | Switzerland | 95.1 /100 | #121 | Exceptional 20.0% |
| Immigrants | South America | 95.0 /100 | #122 | Exceptional 20.0% |
| Brazilians | 94.4 /100 | #123 | Exceptional 20.1% |
| Immigrants | Chile | 94.3 /100 | #124 | Exceptional 20.1% |
| Immigrants | South Africa | 93.9 /100 | #125 | Exceptional 20.1% |
| Serbians | 93.3 /100 | #126 | Exceptional 20.1% |
| Mongolians | 93.2 /100 | #127 | Exceptional 20.2% |
| Immigrants | Spain | 92.7 /100 | #128 | Exceptional 20.2% |
| Immigrants | Morocco | 92.4 /100 | #129 | Exceptional 20.2% |
| Immigrants | Hungary | 92.3 /100 | #130 | Exceptional 20.2% |
| Pakistanis | 92.1 /100 | #131 | Exceptional 20.2% |
| Uruguayans | 92.1 /100 | #132 | Exceptional 20.2% |
| Immigrants | England | 91.9 /100 | #133 | Exceptional 20.2% |
| Immigrants | Venezuela | 91.5 /100 | #134 | Exceptional 20.2% |
| Immigrants | Iraq | 91.2 /100 | #135 | Exceptional 20.2% |
| Immigrants | Canada | 91.2 /100 | #136 | Exceptional 20.2% |
| Immigrants | Nepal | 90.6 /100 | #137 | Exceptional 20.3% |