Immigrants from Nepal vs Hawaiian Female Poverty Among 18-24 Year Olds
COMPARE
Immigrants from Nepal
Hawaiian
Female Poverty Among 18-24 Year Olds
Female Poverty Among 18-24 Year Olds Comparison
Immigrants from Nepal
Hawaiians
20.7%
FEMALE POVERTY AMONG 18-24 YEAR OLDS
9.6/ 100
METRIC RATING
218th/ 347
METRIC RANK
18.7%
FEMALE POVERTY AMONG 18-24 YEAR OLDS
99.6/ 100
METRIC RATING
74th/ 347
METRIC RANK
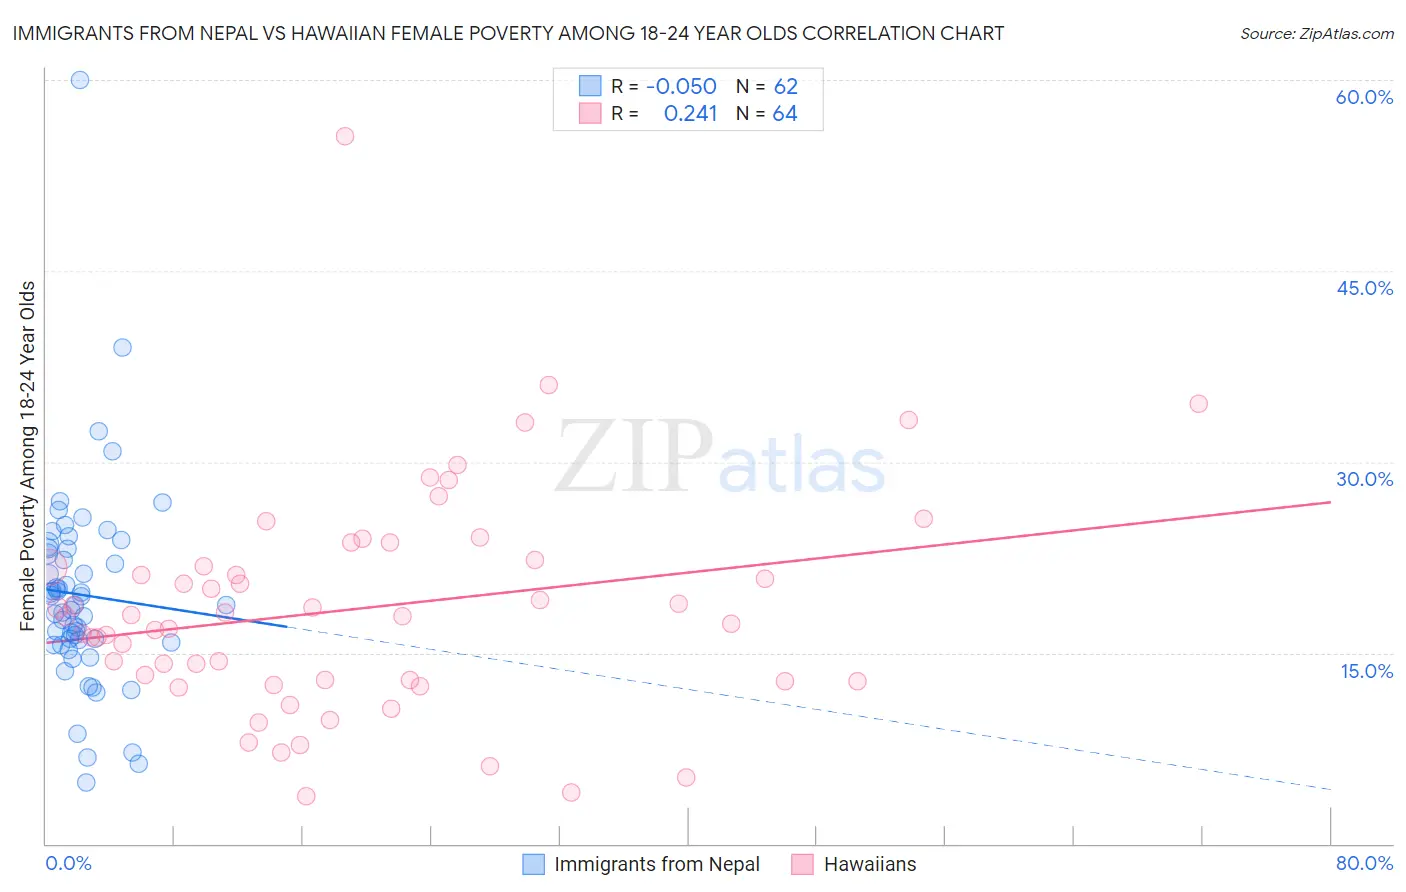
Immigrants from Nepal vs Hawaiian Female Poverty Among 18-24 Year Olds Correlation Chart
The statistical analysis conducted on geographies consisting of 184,918,180 people shows a slight negative correlation between the proportion of Immigrants from Nepal and poverty level among females between the ages 18 and 24 in the United States with a correlation coefficient (R) of -0.050 and weighted average of 20.7%. Similarly, the statistical analysis conducted on geographies consisting of 322,443,370 people shows a weak positive correlation between the proportion of Hawaiians and poverty level among females between the ages 18 and 24 in the United States with a correlation coefficient (R) of 0.241 and weighted average of 18.7%, a difference of 10.3%.
Female Poverty Among 18-24 Year Olds Correlation Summary
| Measurement | Immigrants from Nepal | Hawaiian |
| Minimum | 4.8% | 3.8% |
| Maximum | 60.0% | 55.6% |
| Range | 55.2% | 51.8% |
| Mean | 19.5% | 18.5% |
| Median | 18.8% | 17.9% |
| Interquartile 25% (IQ1) | 15.8% | 12.8% |
| Interquartile 75% (IQ3) | 23.1% | 22.0% |
| Interquartile Range (IQR) | 7.4% | 9.3% |
| Standard Deviation (Sample) | 8.1% | 8.8% |
| Standard Deviation (Population) | 8.0% | 8.7% |
Similar Demographics by Female Poverty Among 18-24 Year Olds
Demographics Similar to Immigrants from Nepal by Female Poverty Among 18-24 Year Olds
In terms of female poverty among 18-24 year olds, the demographic groups most similar to Immigrants from Nepal are Immigrants from Laos (20.6%, a difference of 0.010%), Immigrants from Micronesia (20.7%, a difference of 0.010%), British (20.7%, a difference of 0.030%), Immigrants from Western Africa (20.6%, a difference of 0.080%), and Spanish (20.6%, a difference of 0.10%).
| Demographics | Rating | Rank | Female Poverty Among 18-24 Year Olds |
| Immigrants | Western Europe | 13.5 /100 | #211 | Poor 20.6% |
| Liberians | 11.6 /100 | #212 | Poor 20.6% |
| Northern Europeans | 11.6 /100 | #213 | Poor 20.6% |
| Immigrants | South Africa | 10.7 /100 | #214 | Poor 20.6% |
| Spanish | 10.4 /100 | #215 | Poor 20.6% |
| Immigrants | Western Africa | 10.2 /100 | #216 | Poor 20.6% |
| Immigrants | Laos | 9.7 /100 | #217 | Tragic 20.6% |
| Immigrants | Nepal | 9.6 /100 | #218 | Tragic 20.7% |
| Immigrants | Micronesia | 9.6 /100 | #219 | Tragic 20.7% |
| British | 9.4 /100 | #220 | Tragic 20.7% |
| Barbadians | 9.0 /100 | #221 | Tragic 20.7% |
| Guatemalans | 8.1 /100 | #222 | Tragic 20.7% |
| French | 7.9 /100 | #223 | Tragic 20.7% |
| Immigrants | Liberia | 7.6 /100 | #224 | Tragic 20.7% |
| Norwegians | 7.3 /100 | #225 | Tragic 20.7% |
Demographics Similar to Hawaiians by Female Poverty Among 18-24 Year Olds
In terms of female poverty among 18-24 year olds, the demographic groups most similar to Hawaiians are Lithuanian (18.7%, a difference of 0.19%), Polish (18.8%, a difference of 0.21%), Armenian (18.7%, a difference of 0.22%), Immigrants from Haiti (18.7%, a difference of 0.24%), and Immigrants from Cambodia (18.8%, a difference of 0.29%).
| Demographics | Rating | Rank | Female Poverty Among 18-24 Year Olds |
| Immigrants | Korea | 99.8 /100 | #67 | Exceptional 18.6% |
| Brazilians | 99.8 /100 | #68 | Exceptional 18.6% |
| Immigrants | Bulgaria | 99.7 /100 | #69 | Exceptional 18.6% |
| Immigrants | Costa Rica | 99.7 /100 | #70 | Exceptional 18.7% |
| Immigrants | Haiti | 99.7 /100 | #71 | Exceptional 18.7% |
| Armenians | 99.7 /100 | #72 | Exceptional 18.7% |
| Lithuanians | 99.7 /100 | #73 | Exceptional 18.7% |
| Hawaiians | 99.6 /100 | #74 | Exceptional 18.7% |
| Poles | 99.6 /100 | #75 | Exceptional 18.8% |
| Immigrants | Cambodia | 99.5 /100 | #76 | Exceptional 18.8% |
| Costa Ricans | 99.5 /100 | #77 | Exceptional 18.8% |
| Immigrants | Europe | 99.5 /100 | #78 | Exceptional 18.8% |
| Uruguayans | 99.5 /100 | #79 | Exceptional 18.8% |
| Palestinians | 99.5 /100 | #80 | Exceptional 18.8% |
| Japanese | 99.5 /100 | #81 | Exceptional 18.8% |