Immigrants from Japan vs Spaniard Single Male Poverty
COMPARE
Immigrants from Japan
Spaniard
Single Male Poverty
Single Male Poverty Comparison
Immigrants from Japan
Spaniards
11.3%
SINGLE MALE POVERTY
100.0/ 100
METRIC RATING
26th/ 347
METRIC RANK
13.7%
SINGLE MALE POVERTY
0.4/ 100
METRIC RATING
255th/ 347
METRIC RANK
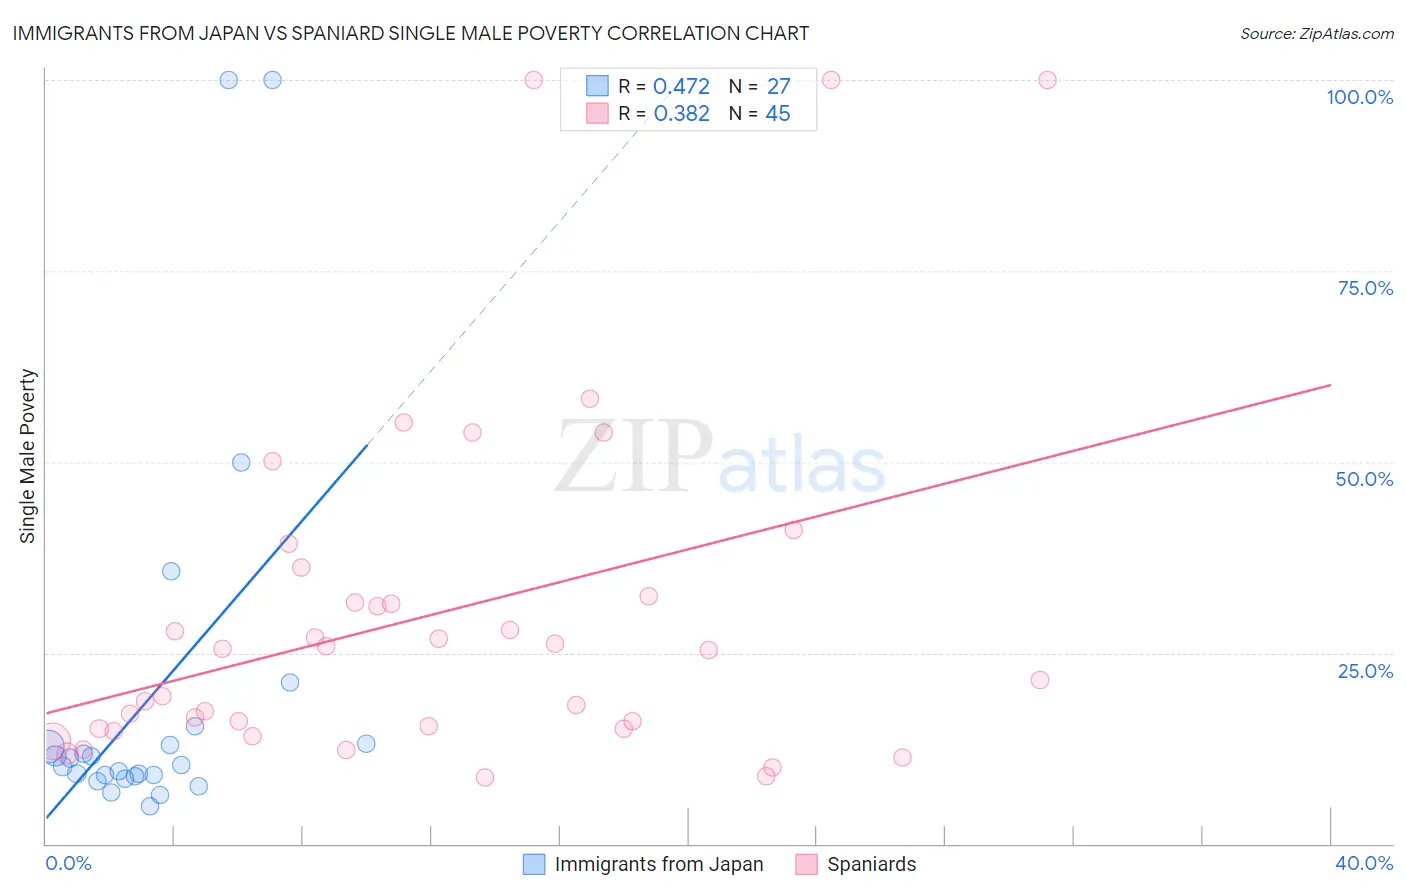
Immigrants from Japan vs Spaniard Single Male Poverty Correlation Chart
The statistical analysis conducted on geographies consisting of 305,055,385 people shows a moderate positive correlation between the proportion of Immigrants from Japan and poverty level among single males in the United States with a correlation coefficient (R) of 0.472 and weighted average of 11.3%. Similarly, the statistical analysis conducted on geographies consisting of 390,345,278 people shows a mild positive correlation between the proportion of Spaniards and poverty level among single males in the United States with a correlation coefficient (R) of 0.382 and weighted average of 13.7%, a difference of 21.4%.
Single Male Poverty Correlation Summary
| Measurement | Immigrants from Japan | Spaniard |
| Minimum | 4.9% | 8.7% |
| Maximum | 100.0% | 100.0% |
| Range | 95.1% | 91.3% |
| Mean | 19.4% | 30.0% |
| Median | 10.3% | 25.4% |
| Interquartile 25% (IQ1) | 8.8% | 15.0% |
| Interquartile 75% (IQ3) | 13.1% | 34.3% |
| Interquartile Range (IQR) | 4.3% | 19.3% |
| Standard Deviation (Sample) | 25.1% | 23.1% |
| Standard Deviation (Population) | 24.6% | 22.8% |
Similar Demographics by Single Male Poverty
Demographics Similar to Immigrants from Japan by Single Male Poverty
In terms of single male poverty, the demographic groups most similar to Immigrants from Japan are Maltese (11.3%, a difference of 0.33%), Indian (Asian) (11.3%, a difference of 0.35%), Bolivian (11.2%, a difference of 0.55%), Immigrants from China (11.4%, a difference of 0.71%), and Immigrants from Pakistan (11.2%, a difference of 0.76%).
| Demographics | Rating | Rank | Single Male Poverty |
| Immigrants | Moldova | 100.0 /100 | #19 | Exceptional 11.2% |
| Ethiopians | 100.0 /100 | #20 | Exceptional 11.2% |
| Asians | 100.0 /100 | #21 | Exceptional 11.2% |
| Immigrants | Pakistan | 100.0 /100 | #22 | Exceptional 11.2% |
| Bolivians | 100.0 /100 | #23 | Exceptional 11.2% |
| Indians (Asian) | 100.0 /100 | #24 | Exceptional 11.3% |
| Maltese | 100.0 /100 | #25 | Exceptional 11.3% |
| Immigrants | Japan | 100.0 /100 | #26 | Exceptional 11.3% |
| Immigrants | China | 100.0 /100 | #27 | Exceptional 11.4% |
| Immigrants | Asia | 100.0 /100 | #28 | Exceptional 11.4% |
| Immigrants | Egypt | 100.0 /100 | #29 | Exceptional 11.4% |
| Iranians | 100.0 /100 | #30 | Exceptional 11.4% |
| Immigrants | Iran | 100.0 /100 | #31 | Exceptional 11.4% |
| Immigrants | Eastern Asia | 100.0 /100 | #32 | Exceptional 11.4% |
| Immigrants | Vietnam | 100.0 /100 | #33 | Exceptional 11.4% |
Demographics Similar to Spaniards by Single Male Poverty
In terms of single male poverty, the demographic groups most similar to Spaniards are Immigrants from Belize (13.7%, a difference of 0.10%), Subsaharan African (13.7%, a difference of 0.11%), Immigrants from Central America (13.8%, a difference of 0.29%), Immigrants from Guatemala (13.8%, a difference of 0.35%), and Guatemalan (13.8%, a difference of 0.39%).
| Demographics | Rating | Rank | Single Male Poverty |
| Czechs | 1.2 /100 | #248 | Tragic 13.5% |
| Spanish | 1.0 /100 | #249 | Tragic 13.6% |
| Immigrants | Somalia | 1.0 /100 | #250 | Tragic 13.6% |
| Immigrants | Zaire | 0.9 /100 | #251 | Tragic 13.6% |
| Finns | 0.9 /100 | #252 | Tragic 13.6% |
| German Russians | 0.8 /100 | #253 | Tragic 13.6% |
| Sub-Saharan Africans | 0.5 /100 | #254 | Tragic 13.7% |
| Spaniards | 0.4 /100 | #255 | Tragic 13.7% |
| Immigrants | Belize | 0.4 /100 | #256 | Tragic 13.7% |
| Immigrants | Central America | 0.3 /100 | #257 | Tragic 13.8% |
| Immigrants | Guatemala | 0.3 /100 | #258 | Tragic 13.8% |
| Guatemalans | 0.3 /100 | #259 | Tragic 13.8% |
| Swiss | 0.3 /100 | #260 | Tragic 13.8% |
| Hungarians | 0.3 /100 | #261 | Tragic 13.8% |
| Fijians | 0.3 /100 | #262 | Tragic 13.8% |