Immigrants from Micronesia vs Ottawa Single Father Poverty
COMPARE
Immigrants from Micronesia
Ottawa
Single Father Poverty
Single Father Poverty Comparison
Immigrants from Micronesia
Ottawa
18.6%
SINGLE FATHER POVERTY
0.0/ 100
METRIC RATING
309th/ 347
METRIC RANK
18.6%
SINGLE FATHER POVERTY
0.0/ 100
METRIC RATING
308th/ 347
METRIC RANK
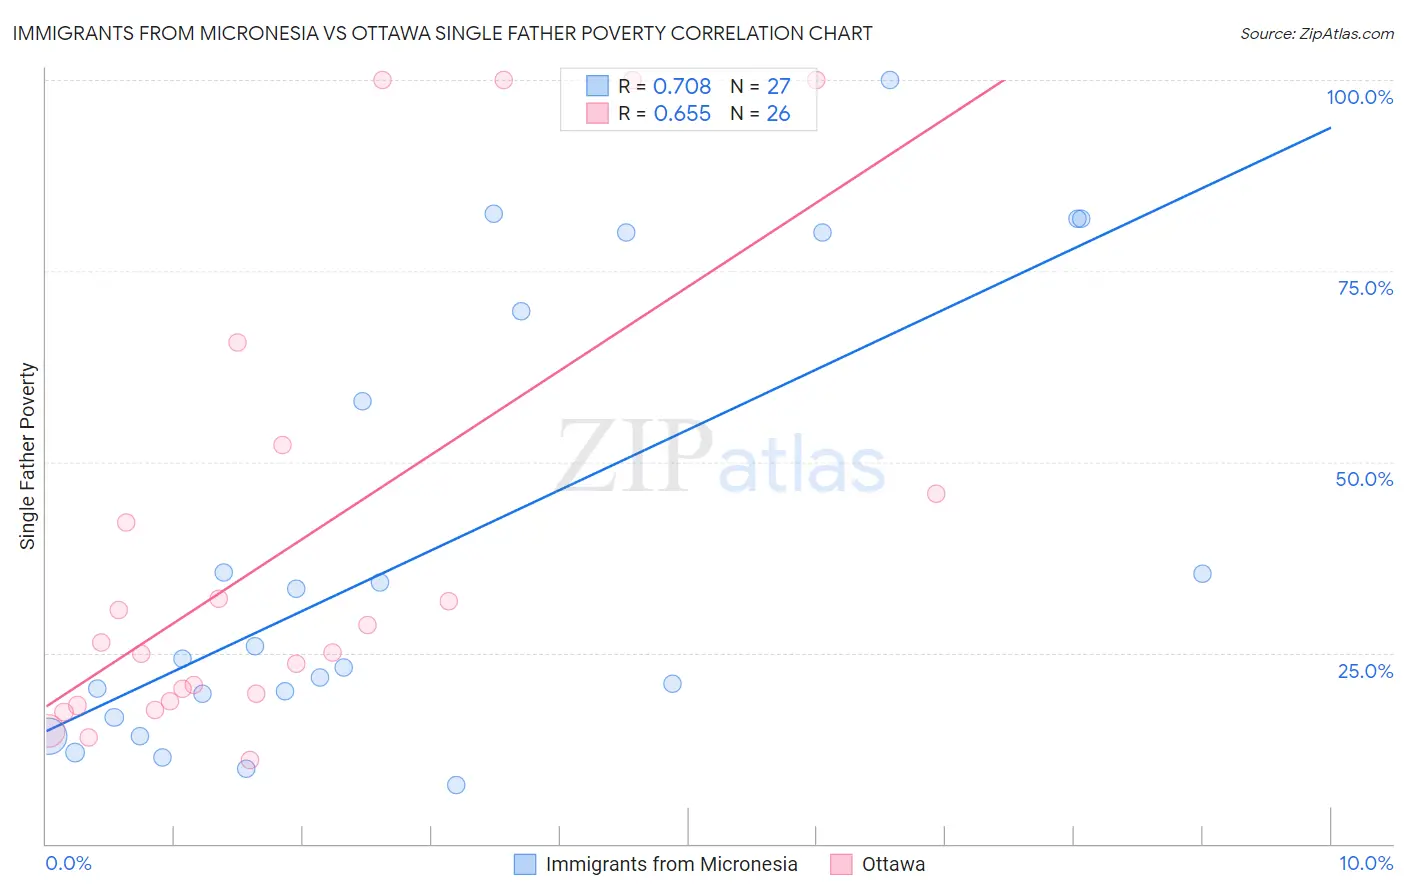
Immigrants from Micronesia vs Ottawa Single Father Poverty Correlation Chart
The statistical analysis conducted on geographies consisting of 57,566,995 people shows a strong positive correlation between the proportion of Immigrants from Micronesia and poverty level among single fathers in the United States with a correlation coefficient (R) of 0.708 and weighted average of 18.6%. Similarly, the statistical analysis conducted on geographies consisting of 45,685,230 people shows a significant positive correlation between the proportion of Ottawa and poverty level among single fathers in the United States with a correlation coefficient (R) of 0.655 and weighted average of 18.6%, a difference of 0.11%.
Single Father Poverty Correlation Summary
| Measurement | Immigrants from Micronesia | Ottawa |
| Minimum | 7.7% | 10.9% |
| Maximum | 100.0% | 100.0% |
| Range | 92.3% | 89.1% |
| Mean | 38.3% | 38.5% |
| Median | 24.3% | 25.7% |
| Interquartile 25% (IQ1) | 16.6% | 18.7% |
| Interquartile 75% (IQ3) | 69.8% | 45.8% |
| Interquartile Range (IQR) | 53.2% | 27.1% |
| Standard Deviation (Sample) | 28.7% | 29.5% |
| Standard Deviation (Population) | 28.2% | 28.9% |
Demographics Similar to Immigrants from Micronesia and Ottawa by Single Father Poverty
In terms of single father poverty, the demographic groups most similar to Immigrants from Micronesia are French Canadian (18.6%, a difference of 0.13%), Scotch-Irish (18.6%, a difference of 0.17%), Blackfeet (18.5%, a difference of 0.39%), Ute (18.5%, a difference of 0.44%), and Celtic (18.5%, a difference of 0.58%). Similarly, the demographic groups most similar to Ottawa are French Canadian (18.6%, a difference of 0.020%), Scotch-Irish (18.6%, a difference of 0.060%), Blackfeet (18.5%, a difference of 0.28%), Ute (18.5%, a difference of 0.33%), and Celtic (18.5%, a difference of 0.47%).
| Demographics | Rating | Rank | Single Father Poverty |
| Africans | 0.0 /100 | #298 | Tragic 18.3% |
| Whites/Caucasians | 0.0 /100 | #299 | Tragic 18.4% |
| Immigrants | Dominican Republic | 0.0 /100 | #300 | Tragic 18.4% |
| Hungarians | 0.0 /100 | #301 | Tragic 18.5% |
| Comanche | 0.0 /100 | #302 | Tragic 18.5% |
| Celtics | 0.0 /100 | #303 | Tragic 18.5% |
| Ute | 0.0 /100 | #304 | Tragic 18.5% |
| Blackfeet | 0.0 /100 | #305 | Tragic 18.5% |
| Scotch-Irish | 0.0 /100 | #306 | Tragic 18.6% |
| French Canadians | 0.0 /100 | #307 | Tragic 18.6% |
| Ottawa | 0.0 /100 | #308 | Tragic 18.6% |
| Immigrants | Micronesia | 0.0 /100 | #309 | Tragic 18.6% |
| Chippewa | 0.0 /100 | #310 | Tragic 18.8% |
| Immigrants | Nonimmigrants | 0.0 /100 | #311 | Tragic 18.8% |
| Immigrants | Dominica | 0.0 /100 | #312 | Tragic 18.9% |
| Potawatomi | 0.0 /100 | #313 | Tragic 18.9% |
| Delaware | 0.0 /100 | #314 | Tragic 18.9% |
| Chickasaw | 0.0 /100 | #315 | Tragic 19.0% |
| Osage | 0.0 /100 | #316 | Tragic 19.0% |
| Dominicans | 0.0 /100 | #317 | Tragic 19.1% |
| Dutch West Indians | 0.0 /100 | #318 | Tragic 19.2% |