Immigrants from Japan vs Immigrants from Eastern Europe Female Poverty Among 25-34 Year Olds
COMPARE
Immigrants from Japan
Immigrants from Eastern Europe
Female Poverty Among 25-34 Year Olds
Female Poverty Among 25-34 Year Olds Comparison
Immigrants from Japan
Immigrants from Eastern Europe
11.6%
FEMALE POVERTY AMONG 25-34 YEAR OLDS
99.9/ 100
METRIC RATING
31st/ 347
METRIC RANK
12.0%
FEMALE POVERTY AMONG 25-34 YEAR OLDS
99.6/ 100
METRIC RATING
52nd/ 347
METRIC RANK
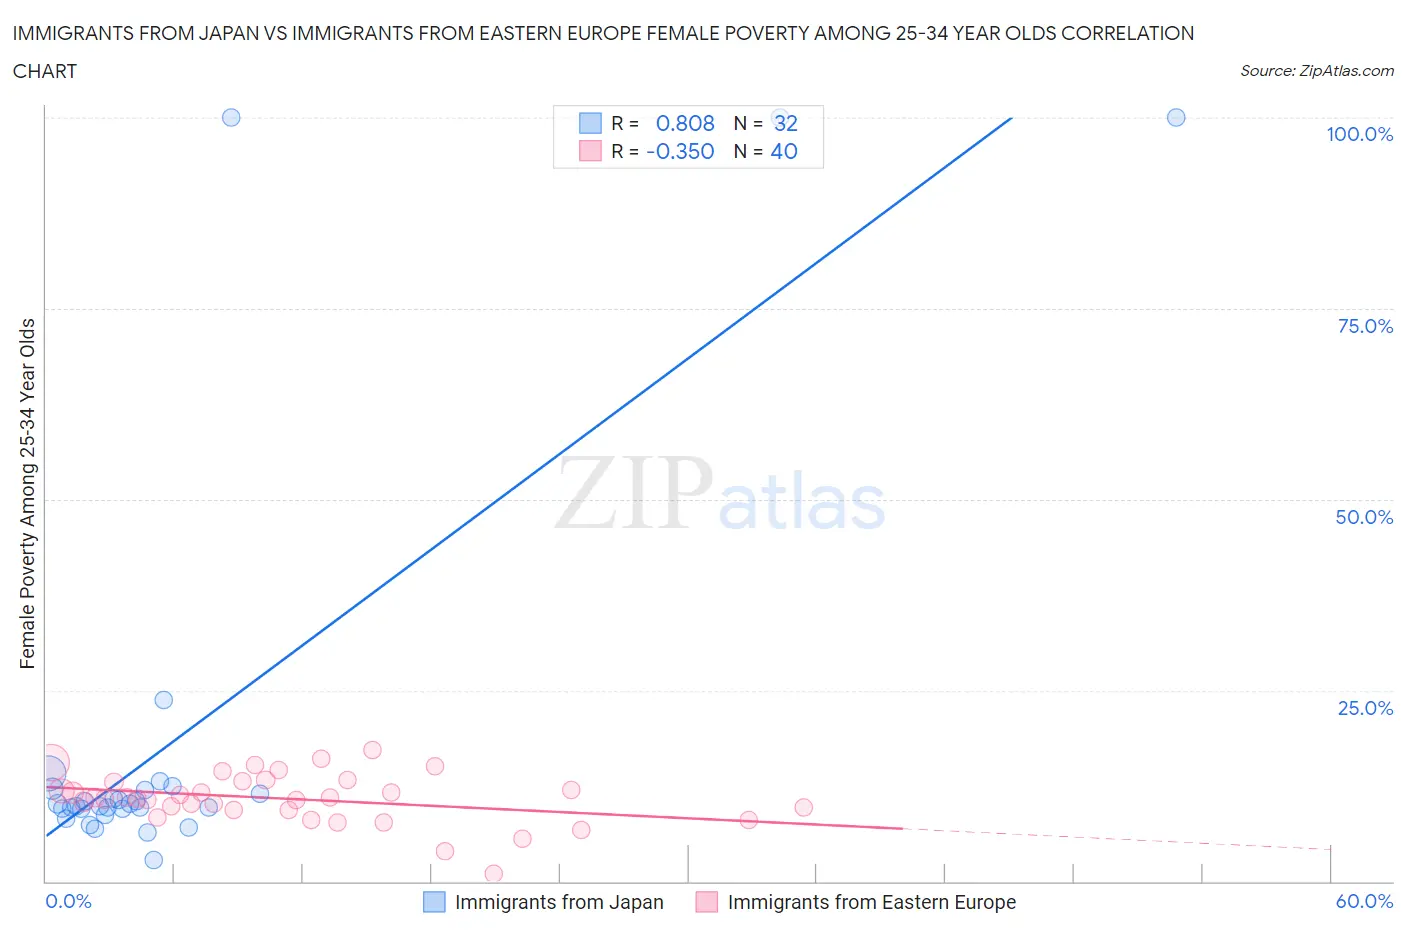
Immigrants from Japan vs Immigrants from Eastern Europe Female Poverty Among 25-34 Year Olds Correlation Chart
The statistical analysis conducted on geographies consisting of 335,631,961 people shows a very strong positive correlation between the proportion of Immigrants from Japan and poverty level among females between the ages 25 and 34 in the United States with a correlation coefficient (R) of 0.808 and weighted average of 11.6%. Similarly, the statistical analysis conducted on geographies consisting of 463,335,810 people shows a mild negative correlation between the proportion of Immigrants from Eastern Europe and poverty level among females between the ages 25 and 34 in the United States with a correlation coefficient (R) of -0.350 and weighted average of 12.0%, a difference of 3.6%.
Female Poverty Among 25-34 Year Olds Correlation Summary
| Measurement | Immigrants from Japan | Immigrants from Eastern Europe |
| Minimum | 2.8% | 0.98% |
| Maximum | 100.0% | 17.1% |
| Range | 97.3% | 16.1% |
| Mean | 18.6% | 10.8% |
| Median | 10.0% | 10.8% |
| Interquartile 25% (IQ1) | 9.4% | 9.3% |
| Interquartile 75% (IQ3) | 12.0% | 13.0% |
| Interquartile Range (IQR) | 2.5% | 3.7% |
| Standard Deviation (Sample) | 26.8% | 3.3% |
| Standard Deviation (Population) | 26.4% | 3.2% |
Similar Demographics by Female Poverty Among 25-34 Year Olds
Demographics Similar to Immigrants from Japan by Female Poverty Among 25-34 Year Olds
In terms of female poverty among 25-34 year olds, the demographic groups most similar to Immigrants from Japan are Cypriot (11.5%, a difference of 0.29%), Immigrants from Asia (11.6%, a difference of 0.30%), Bulgarian (11.5%, a difference of 0.31%), Immigrants from Pakistan (11.5%, a difference of 0.32%), and Immigrants from Greece (11.5%, a difference of 0.55%).
| Demographics | Rating | Rank | Female Poverty Among 25-34 Year Olds |
| Maltese | 99.9 /100 | #24 | Exceptional 11.4% |
| Bhutanese | 99.9 /100 | #25 | Exceptional 11.4% |
| Tongans | 99.9 /100 | #26 | Exceptional 11.5% |
| Immigrants | Greece | 99.9 /100 | #27 | Exceptional 11.5% |
| Immigrants | Pakistan | 99.9 /100 | #28 | Exceptional 11.5% |
| Bulgarians | 99.9 /100 | #29 | Exceptional 11.5% |
| Cypriots | 99.9 /100 | #30 | Exceptional 11.5% |
| Immigrants | Japan | 99.9 /100 | #31 | Exceptional 11.6% |
| Immigrants | Asia | 99.9 /100 | #32 | Exceptional 11.6% |
| Immigrants | Poland | 99.9 /100 | #33 | Exceptional 11.6% |
| Zimbabweans | 99.9 /100 | #34 | Exceptional 11.7% |
| Cambodians | 99.9 /100 | #35 | Exceptional 11.7% |
| Immigrants | Sri Lanka | 99.8 /100 | #36 | Exceptional 11.8% |
| Taiwanese | 99.8 /100 | #37 | Exceptional 11.8% |
| Immigrants | North Macedonia | 99.8 /100 | #38 | Exceptional 11.8% |
Demographics Similar to Immigrants from Eastern Europe by Female Poverty Among 25-34 Year Olds
In terms of female poverty among 25-34 year olds, the demographic groups most similar to Immigrants from Eastern Europe are Paraguayan (12.0%, a difference of 0.020%), Immigrants from Croatia (12.0%, a difference of 0.030%), Immigrants from Egypt (12.0%, a difference of 0.040%), Immigrants from Belarus (12.0%, a difference of 0.12%), and Immigrants from Israel (12.0%, a difference of 0.12%).
| Demographics | Rating | Rank | Female Poverty Among 25-34 Year Olds |
| Macedonians | 99.7 /100 | #45 | Exceptional 11.9% |
| Immigrants | Serbia | 99.7 /100 | #46 | Exceptional 11.9% |
| Koreans | 99.6 /100 | #47 | Exceptional 12.0% |
| Immigrants | Belarus | 99.6 /100 | #48 | Exceptional 12.0% |
| Immigrants | Egypt | 99.6 /100 | #49 | Exceptional 12.0% |
| Immigrants | Croatia | 99.6 /100 | #50 | Exceptional 12.0% |
| Paraguayans | 99.6 /100 | #51 | Exceptional 12.0% |
| Immigrants | Eastern Europe | 99.6 /100 | #52 | Exceptional 12.0% |
| Immigrants | Israel | 99.6 /100 | #53 | Exceptional 12.0% |
| Eastern Europeans | 99.6 /100 | #54 | Exceptional 12.0% |
| Immigrants | Philippines | 99.5 /100 | #55 | Exceptional 12.0% |
| Luxembourgers | 99.5 /100 | #56 | Exceptional 12.1% |
| Jordanians | 99.4 /100 | #57 | Exceptional 12.1% |
| Immigrants | Romania | 99.4 /100 | #58 | Exceptional 12.1% |
| Russians | 99.4 /100 | #59 | Exceptional 12.1% |