Carpatho Rusyn vs Marshallese Male Poverty
COMPARE
Carpatho Rusyn
Marshallese
Male Poverty
Male Poverty Comparison
Carpatho Rusyns
Marshallese
10.2%
MALE POVERTY
96.9/ 100
METRIC RATING
75th/ 347
METRIC RANK
12.5%
MALE POVERTY
0.8/ 100
METRIC RATING
230th/ 347
METRIC RANK
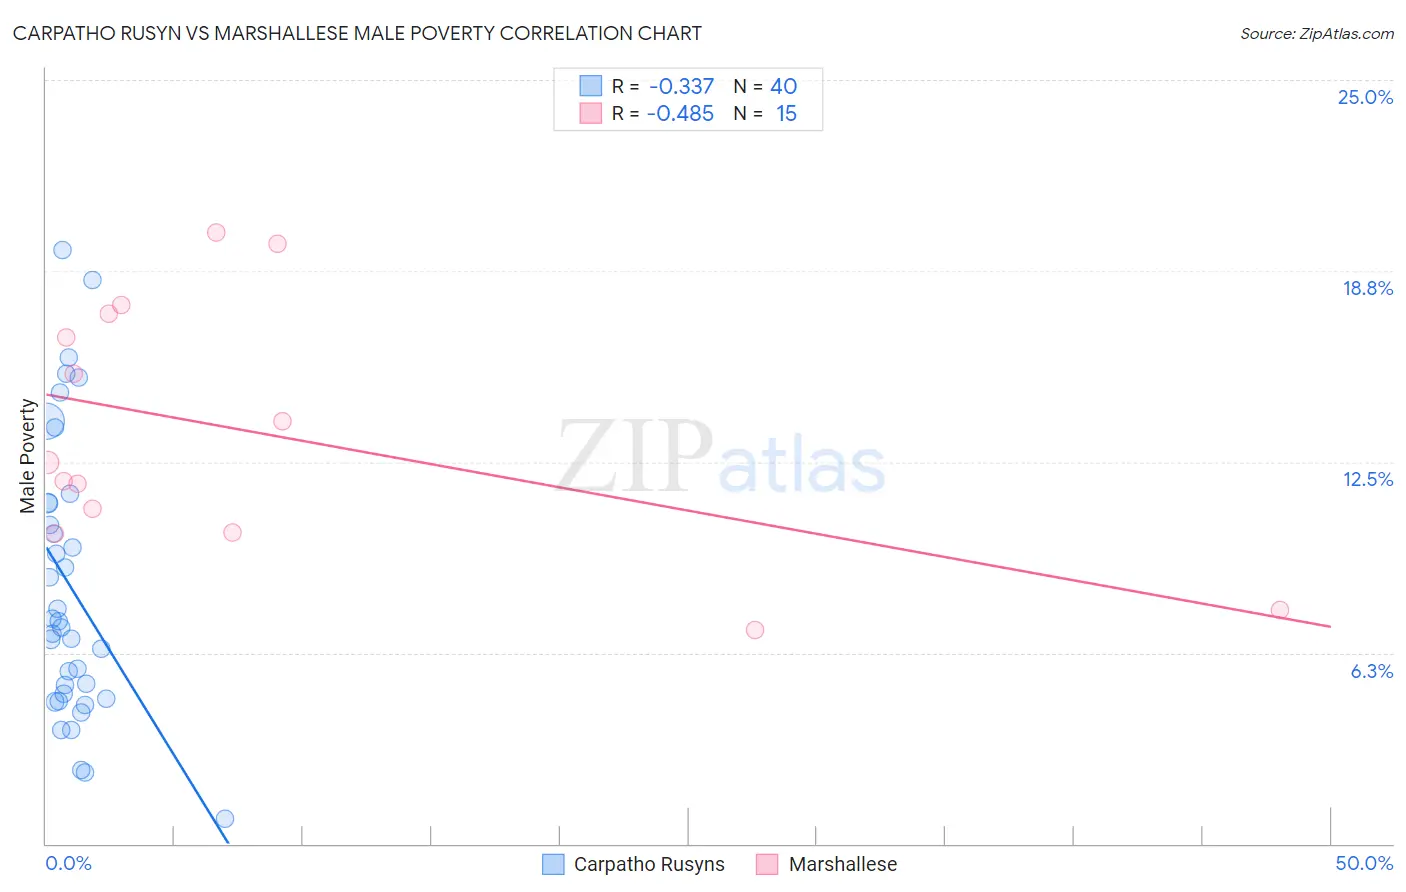
Carpatho Rusyn vs Marshallese Male Poverty Correlation Chart
The statistical analysis conducted on geographies consisting of 58,868,147 people shows a mild negative correlation between the proportion of Carpatho Rusyns and poverty level among males in the United States with a correlation coefficient (R) of -0.337 and weighted average of 10.2%. Similarly, the statistical analysis conducted on geographies consisting of 14,760,991 people shows a moderate negative correlation between the proportion of Marshallese and poverty level among males in the United States with a correlation coefficient (R) of -0.485 and weighted average of 12.5%, a difference of 22.0%.
Male Poverty Correlation Summary
| Measurement | Carpatho Rusyn | Marshallese |
| Minimum | 0.81% | 7.0% |
| Maximum | 19.4% | 20.0% |
| Range | 18.6% | 13.0% |
| Mean | 8.4% | 13.5% |
| Median | 7.2% | 12.5% |
| Interquartile 25% (IQ1) | 4.8% | 10.2% |
| Interquartile 75% (IQ3) | 11.2% | 17.3% |
| Interquartile Range (IQR) | 6.3% | 7.2% |
| Standard Deviation (Sample) | 4.6% | 4.1% |
| Standard Deviation (Population) | 4.5% | 4.0% |
Similar Demographics by Male Poverty
Demographics Similar to Carpatho Rusyns by Male Poverty
In terms of male poverty, the demographic groups most similar to Carpatho Rusyns are Immigrants from Eastern Europe (10.2%, a difference of 0.0%), Dutch (10.2%, a difference of 0.010%), Immigrants from Belgium (10.3%, a difference of 0.040%), Irish (10.3%, a difference of 0.060%), and Immigrants from Asia (10.2%, a difference of 0.080%).
| Demographics | Rating | Rank | Male Poverty |
| Immigrants | Sri Lanka | 97.2 /100 | #68 | Exceptional 10.2% |
| Immigrants | Australia | 97.1 /100 | #69 | Exceptional 10.2% |
| Paraguayans | 97.1 /100 | #70 | Exceptional 10.2% |
| Europeans | 97.1 /100 | #71 | Exceptional 10.2% |
| Immigrants | Canada | 97.1 /100 | #72 | Exceptional 10.2% |
| Immigrants | Asia | 97.0 /100 | #73 | Exceptional 10.2% |
| Immigrants | Eastern Europe | 96.9 /100 | #74 | Exceptional 10.2% |
| Carpatho Rusyns | 96.9 /100 | #75 | Exceptional 10.2% |
| Dutch | 96.9 /100 | #76 | Exceptional 10.2% |
| Immigrants | Belgium | 96.8 /100 | #77 | Exceptional 10.3% |
| Irish | 96.8 /100 | #78 | Exceptional 10.3% |
| Immigrants | North America | 96.5 /100 | #79 | Exceptional 10.3% |
| English | 96.4 /100 | #80 | Exceptional 10.3% |
| Belgians | 95.9 /100 | #81 | Exceptional 10.3% |
| Egyptians | 95.9 /100 | #82 | Exceptional 10.3% |
Demographics Similar to Marshallese by Male Poverty
In terms of male poverty, the demographic groups most similar to Marshallese are Salvadoran (12.6%, a difference of 0.56%), Nicaraguan (12.6%, a difference of 0.68%), Fijian (12.6%, a difference of 0.72%), Immigrants from Armenia (12.6%, a difference of 0.79%), and Cuban (12.4%, a difference of 0.98%).
| Demographics | Rating | Rank | Male Poverty |
| Immigrants | Micronesia | 2.1 /100 | #223 | Tragic 12.2% |
| Immigrants | Nigeria | 1.6 /100 | #224 | Tragic 12.3% |
| Osage | 1.5 /100 | #225 | Tragic 12.3% |
| Nigerians | 1.4 /100 | #226 | Tragic 12.3% |
| Alaska Natives | 1.4 /100 | #227 | Tragic 12.4% |
| Alsatians | 1.3 /100 | #228 | Tragic 12.4% |
| Cubans | 1.3 /100 | #229 | Tragic 12.4% |
| Marshallese | 0.8 /100 | #230 | Tragic 12.5% |
| Salvadorans | 0.6 /100 | #231 | Tragic 12.6% |
| Nicaraguans | 0.6 /100 | #232 | Tragic 12.6% |
| Fijians | 0.6 /100 | #233 | Tragic 12.6% |
| Immigrants | Armenia | 0.6 /100 | #234 | Tragic 12.6% |
| Immigrants | Laos | 0.5 /100 | #235 | Tragic 12.6% |
| Immigrants | Saudi Arabia | 0.4 /100 | #236 | Tragic 12.7% |
| French American Indians | 0.4 /100 | #237 | Tragic 12.7% |