Immigrants from Mexico vs Immigrants from Central America Seniors Poverty Over the Age of 75
COMPARE
Immigrants from Mexico
Immigrants from Central America
Seniors Poverty Over the Age of 75
Seniors Poverty Over the Age of 75 Comparison
Immigrants from Mexico
Immigrants from Central America
14.9%
SENIORS POVERTY OVER THE AGE OF 75
0.0/ 100
METRIC RATING
285th/ 347
METRIC RANK
15.0%
SENIORS POVERTY OVER THE AGE OF 75
0.0/ 100
METRIC RATING
286th/ 347
METRIC RANK
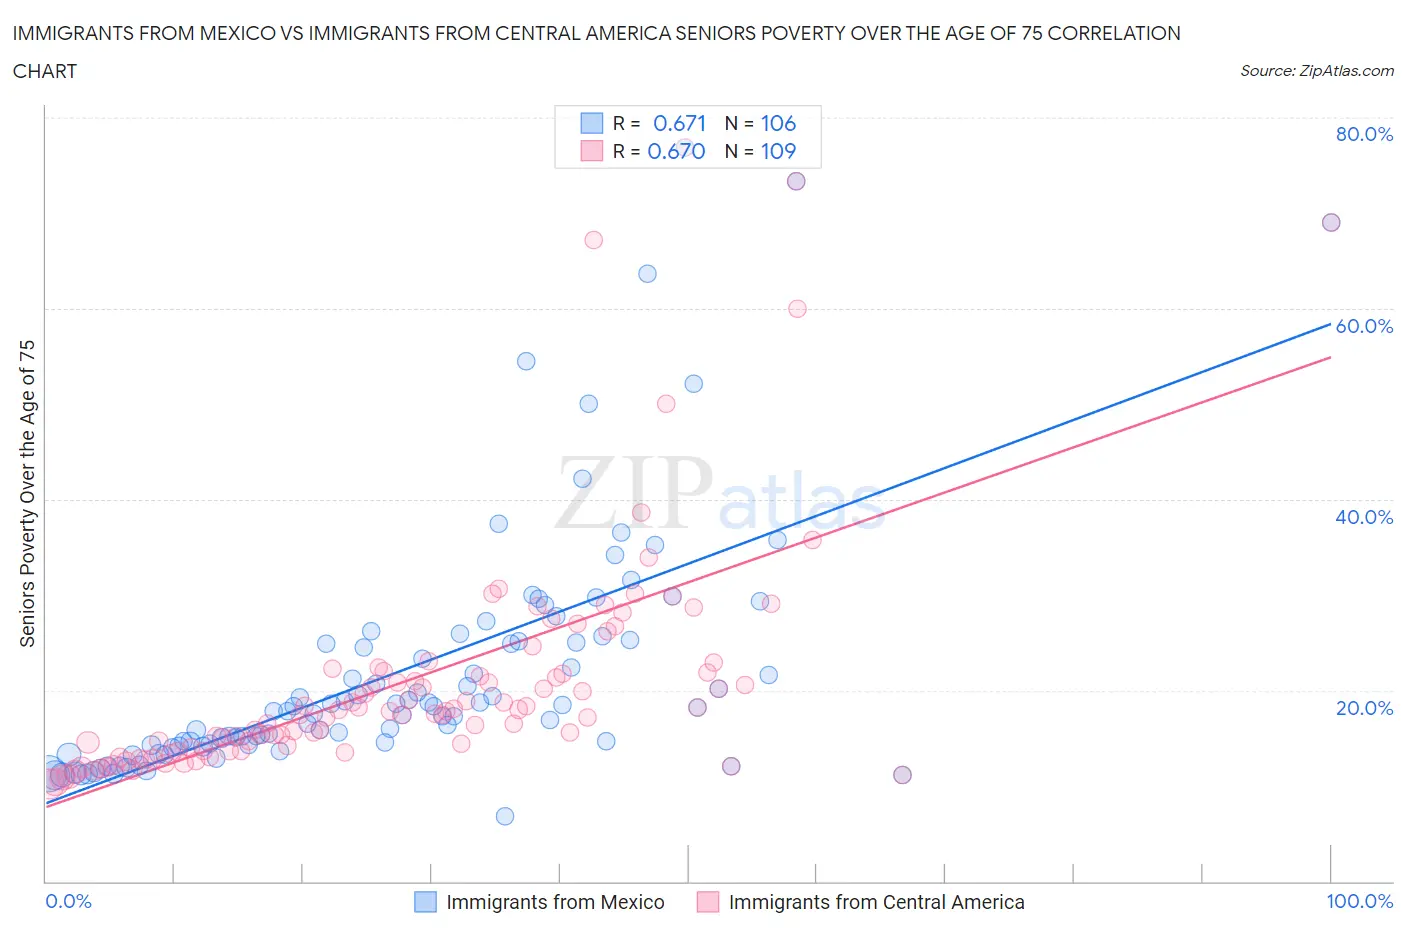
Immigrants from Mexico vs Immigrants from Central America Seniors Poverty Over the Age of 75 Correlation Chart
The statistical analysis conducted on geographies consisting of 503,324,088 people shows a significant positive correlation between the proportion of Immigrants from Mexico and poverty level among seniors over the age of 75 in the United States with a correlation coefficient (R) of 0.671 and weighted average of 14.9%. Similarly, the statistical analysis conducted on geographies consisting of 524,281,293 people shows a significant positive correlation between the proportion of Immigrants from Central America and poverty level among seniors over the age of 75 in the United States with a correlation coefficient (R) of 0.670 and weighted average of 15.0%, a difference of 0.33%.
Seniors Poverty Over the Age of 75 Correlation Summary
| Measurement | Immigrants from Mexico | Immigrants from Central America |
| Minimum | 6.8% | 10.2% |
| Maximum | 76.9% | 76.9% |
| Range | 70.1% | 66.7% |
| Mean | 21.9% | 21.1% |
| Median | 18.0% | 17.8% |
| Interquartile 25% (IQ1) | 14.2% | 13.6% |
| Interquartile 75% (IQ3) | 25.1% | 22.1% |
| Interquartile Range (IQR) | 10.9% | 8.5% |
| Standard Deviation (Sample) | 13.1% | 12.6% |
| Standard Deviation (Population) | 13.1% | 12.5% |
Demographics Similar to Immigrants from Mexico and Immigrants from Central America by Seniors Poverty Over the Age of 75
In terms of seniors poverty over the age of 75, the demographic groups most similar to Immigrants from Mexico are Cheyenne (14.9%, a difference of 0.19%), Guatemalan (14.8%, a difference of 0.83%), Immigrants from Senegal (14.8%, a difference of 0.89%), Immigrants from Guatemala (15.1%, a difference of 0.93%), and Belizean (14.8%, a difference of 1.1%). Similarly, the demographic groups most similar to Immigrants from Central America are Cheyenne (14.9%, a difference of 0.53%), Immigrants from Guatemala (15.1%, a difference of 0.59%), Guatemalan (14.8%, a difference of 1.2%), Jamaican (15.1%, a difference of 1.2%), and Immigrants from Senegal (14.8%, a difference of 1.2%).
| Demographics | Rating | Rank | Seniors Poverty Over the Age of 75 |
| Immigrants | El Salvador | 0.0 /100 | #275 | Tragic 14.5% |
| Soviet Union | 0.0 /100 | #276 | Tragic 14.5% |
| Senegalese | 0.0 /100 | #277 | Tragic 14.5% |
| Immigrants | Colombia | 0.0 /100 | #278 | Tragic 14.6% |
| Blacks/African Americans | 0.0 /100 | #279 | Tragic 14.6% |
| Central Americans | 0.0 /100 | #280 | Tragic 14.7% |
| Belizeans | 0.0 /100 | #281 | Tragic 14.8% |
| Immigrants | Senegal | 0.0 /100 | #282 | Tragic 14.8% |
| Guatemalans | 0.0 /100 | #283 | Tragic 14.8% |
| Cheyenne | 0.0 /100 | #284 | Tragic 14.9% |
| Immigrants | Mexico | 0.0 /100 | #285 | Tragic 14.9% |
| Immigrants | Central America | 0.0 /100 | #286 | Tragic 15.0% |
| Immigrants | Guatemala | 0.0 /100 | #287 | Tragic 15.1% |
| Jamaicans | 0.0 /100 | #288 | Tragic 15.1% |
| Immigrants | Belize | 0.0 /100 | #289 | Tragic 15.2% |
| Immigrants | Azores | 0.0 /100 | #290 | Tragic 15.2% |
| Paiute | 0.0 /100 | #291 | Tragic 15.2% |
| Colville | 0.0 /100 | #292 | Tragic 15.2% |
| Apache | 0.0 /100 | #293 | Tragic 15.3% |
| Immigrants | Jamaica | 0.0 /100 | #294 | Tragic 15.3% |
| U.S. Virgin Islanders | 0.0 /100 | #295 | Tragic 15.4% |