Immigrants from Honduras vs Immigrants from Central America Seniors Poverty Over the Age of 75
COMPARE
Immigrants from Honduras
Immigrants from Central America
Seniors Poverty Over the Age of 75
Seniors Poverty Over the Age of 75 Comparison
Immigrants from Honduras
Immigrants from Central America
15.7%
SENIORS POVERTY OVER THE AGE OF 75
0.0/ 100
METRIC RATING
303rd/ 347
METRIC RANK
15.0%
SENIORS POVERTY OVER THE AGE OF 75
0.0/ 100
METRIC RATING
286th/ 347
METRIC RANK
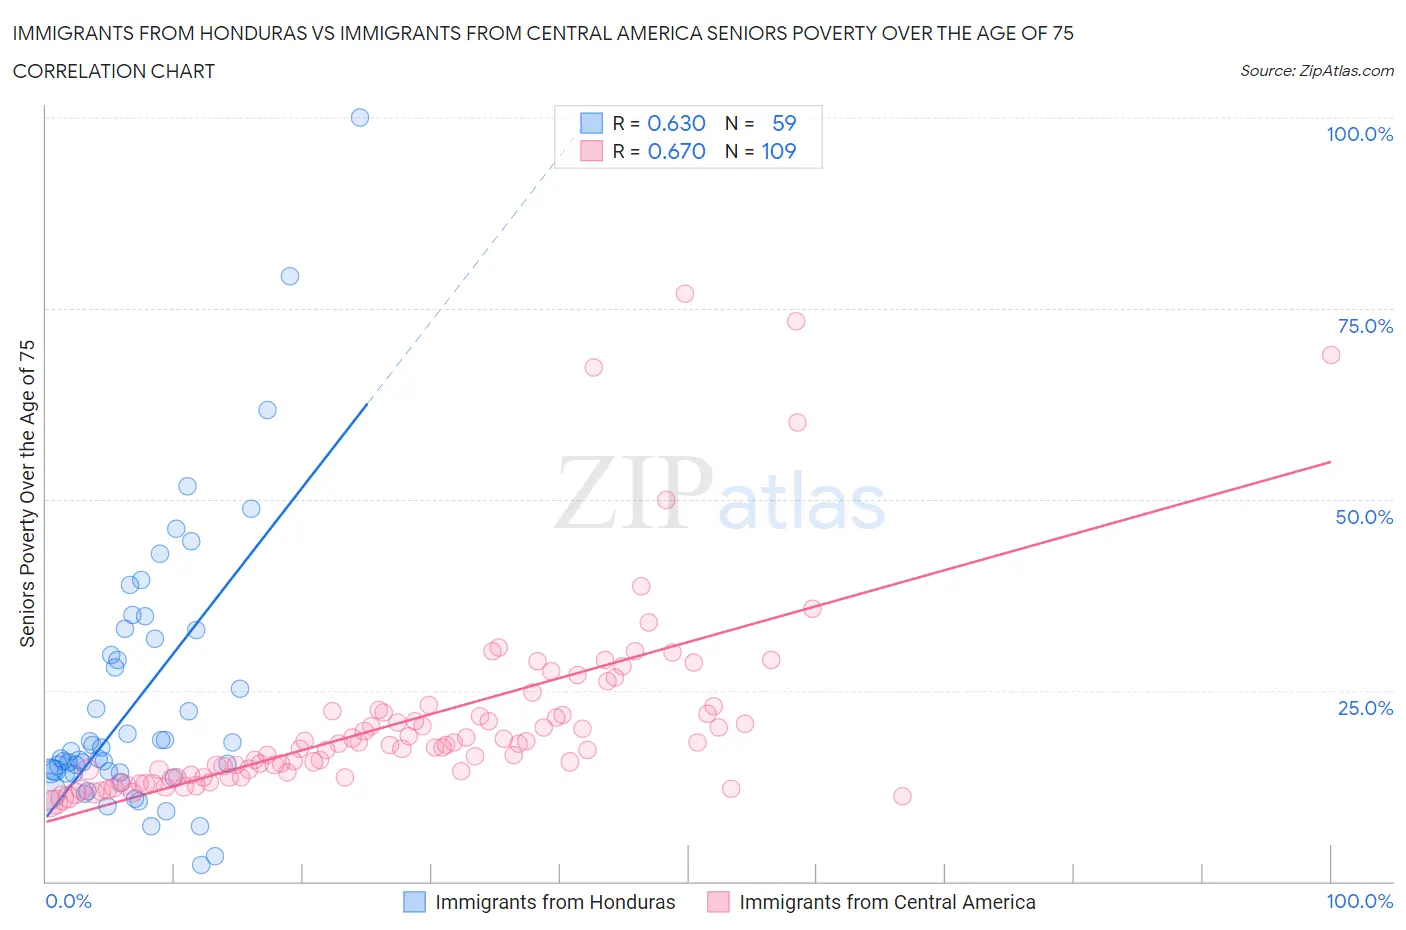
Immigrants from Honduras vs Immigrants from Central America Seniors Poverty Over the Age of 75 Correlation Chart
The statistical analysis conducted on geographies consisting of 320,172,645 people shows a significant positive correlation between the proportion of Immigrants from Honduras and poverty level among seniors over the age of 75 in the United States with a correlation coefficient (R) of 0.630 and weighted average of 15.7%. Similarly, the statistical analysis conducted on geographies consisting of 524,281,293 people shows a significant positive correlation between the proportion of Immigrants from Central America and poverty level among seniors over the age of 75 in the United States with a correlation coefficient (R) of 0.670 and weighted average of 15.0%, a difference of 5.0%.
Seniors Poverty Over the Age of 75 Correlation Summary
| Measurement | Immigrants from Honduras | Immigrants from Central America |
| Minimum | 2.1% | 10.2% |
| Maximum | 100.0% | 76.9% |
| Range | 97.9% | 66.7% |
| Mean | 23.7% | 21.1% |
| Median | 16.1% | 17.8% |
| Interquartile 25% (IQ1) | 14.2% | 13.6% |
| Interquartile 75% (IQ3) | 31.8% | 22.1% |
| Interquartile Range (IQR) | 17.6% | 8.5% |
| Standard Deviation (Sample) | 17.8% | 12.6% |
| Standard Deviation (Population) | 17.7% | 12.5% |
Demographics Similar to Immigrants from Honduras and Immigrants from Central America by Seniors Poverty Over the Age of 75
In terms of seniors poverty over the age of 75, the demographic groups most similar to Immigrants from Honduras are West Indian (15.7%, a difference of 0.17%), Immigrants from Trinidad and Tobago (15.7%, a difference of 0.18%), Immigrants from Latin America (15.6%, a difference of 0.48%), Bahamian (15.5%, a difference of 1.3%), and Spanish American Indian (15.5%, a difference of 1.3%). Similarly, the demographic groups most similar to Immigrants from Central America are Immigrants from Mexico (14.9%, a difference of 0.33%), Cheyenne (14.9%, a difference of 0.53%), Immigrants from Guatemala (15.1%, a difference of 0.59%), Jamaican (15.1%, a difference of 1.2%), and Immigrants from Belize (15.2%, a difference of 1.5%).
| Demographics | Rating | Rank | Seniors Poverty Over the Age of 75 |
| Cheyenne | 0.0 /100 | #284 | Tragic 14.9% |
| Immigrants | Mexico | 0.0 /100 | #285 | Tragic 14.9% |
| Immigrants | Central America | 0.0 /100 | #286 | Tragic 15.0% |
| Immigrants | Guatemala | 0.0 /100 | #287 | Tragic 15.1% |
| Jamaicans | 0.0 /100 | #288 | Tragic 15.1% |
| Immigrants | Belize | 0.0 /100 | #289 | Tragic 15.2% |
| Immigrants | Azores | 0.0 /100 | #290 | Tragic 15.2% |
| Paiute | 0.0 /100 | #291 | Tragic 15.2% |
| Colville | 0.0 /100 | #292 | Tragic 15.2% |
| Apache | 0.0 /100 | #293 | Tragic 15.3% |
| Immigrants | Jamaica | 0.0 /100 | #294 | Tragic 15.3% |
| U.S. Virgin Islanders | 0.0 /100 | #295 | Tragic 15.4% |
| Yuman | 0.0 /100 | #296 | Tragic 15.4% |
| Hondurans | 0.0 /100 | #297 | Tragic 15.4% |
| Natives/Alaskans | 0.0 /100 | #298 | Tragic 15.5% |
| Spanish American Indians | 0.0 /100 | #299 | Tragic 15.5% |
| Bahamians | 0.0 /100 | #300 | Tragic 15.5% |
| Immigrants | Latin America | 0.0 /100 | #301 | Tragic 15.6% |
| West Indians | 0.0 /100 | #302 | Tragic 15.7% |
| Immigrants | Honduras | 0.0 /100 | #303 | Tragic 15.7% |
| Immigrants | Trinidad and Tobago | 0.0 /100 | #304 | Tragic 15.7% |