Immigrants from Croatia vs Immigrants from Central America Seniors Poverty Over the Age of 75
COMPARE
Immigrants from Croatia
Immigrants from Central America
Seniors Poverty Over the Age of 75
Seniors Poverty Over the Age of 75 Comparison
Immigrants from Croatia
Immigrants from Central America
11.5%
SENIORS POVERTY OVER THE AGE OF 75
94.5/ 100
METRIC RATING
88th/ 347
METRIC RANK
15.0%
SENIORS POVERTY OVER THE AGE OF 75
0.0/ 100
METRIC RATING
286th/ 347
METRIC RANK
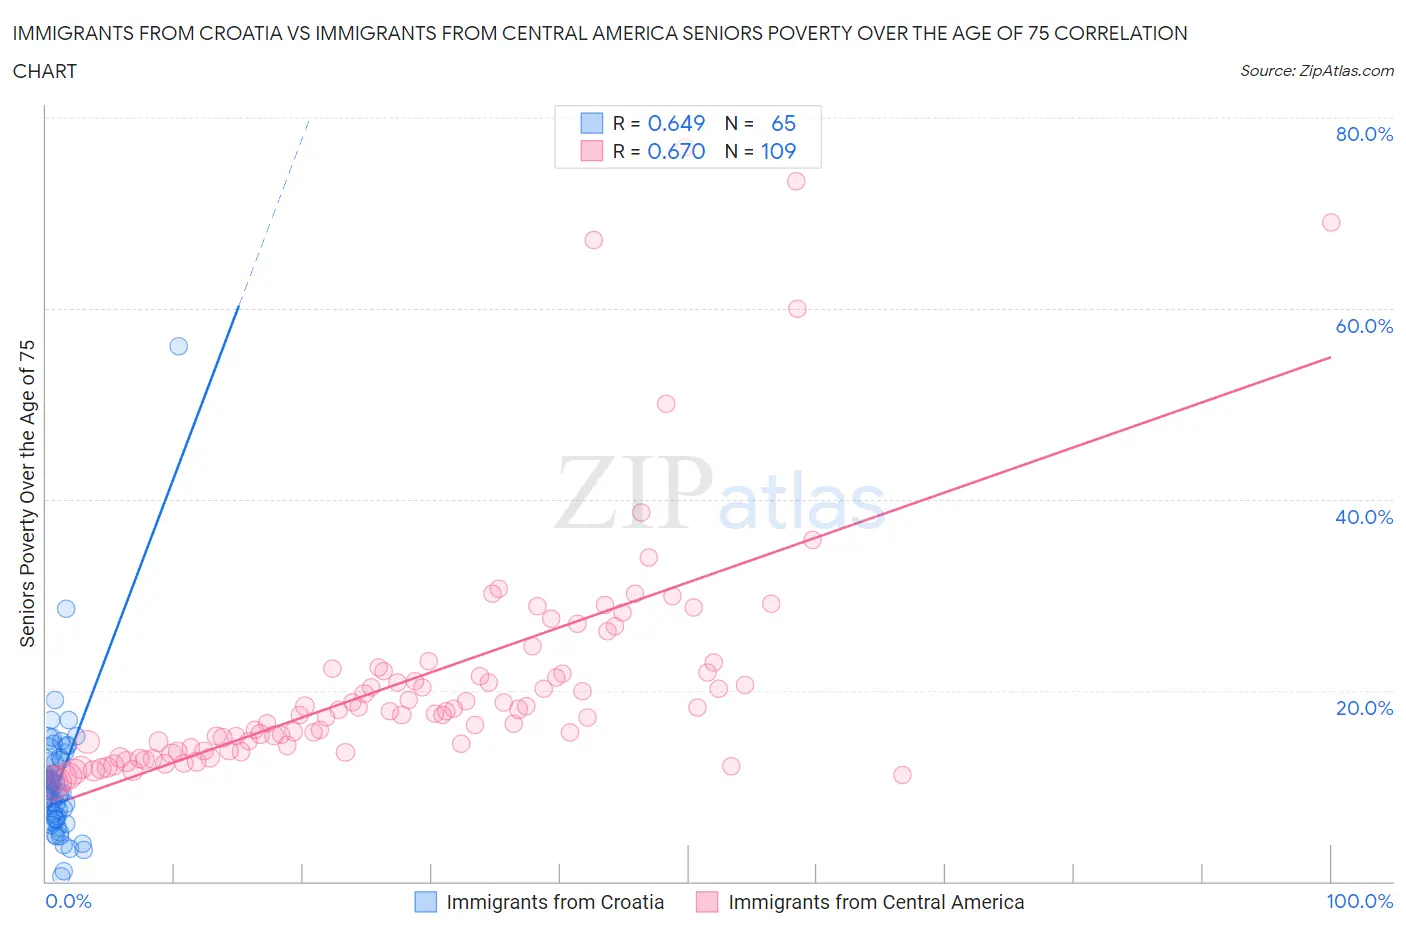
Immigrants from Croatia vs Immigrants from Central America Seniors Poverty Over the Age of 75 Correlation Chart
The statistical analysis conducted on geographies consisting of 132,096,620 people shows a significant positive correlation between the proportion of Immigrants from Croatia and poverty level among seniors over the age of 75 in the United States with a correlation coefficient (R) of 0.649 and weighted average of 11.5%. Similarly, the statistical analysis conducted on geographies consisting of 524,281,293 people shows a significant positive correlation between the proportion of Immigrants from Central America and poverty level among seniors over the age of 75 in the United States with a correlation coefficient (R) of 0.670 and weighted average of 15.0%, a difference of 30.3%.
Seniors Poverty Over the Age of 75 Correlation Summary
| Measurement | Immigrants from Croatia | Immigrants from Central America |
| Minimum | 0.52% | 10.2% |
| Maximum | 56.0% | 76.9% |
| Range | 55.5% | 66.7% |
| Mean | 10.5% | 21.1% |
| Median | 9.7% | 17.8% |
| Interquartile 25% (IQ1) | 6.5% | 13.6% |
| Interquartile 75% (IQ3) | 12.6% | 22.1% |
| Interquartile Range (IQR) | 6.1% | 8.5% |
| Standard Deviation (Sample) | 7.3% | 12.6% |
| Standard Deviation (Population) | 7.3% | 12.5% |
Similar Demographics by Seniors Poverty Over the Age of 75
Demographics Similar to Immigrants from Croatia by Seniors Poverty Over the Age of 75
In terms of seniors poverty over the age of 75, the demographic groups most similar to Immigrants from Croatia are Korean (11.5%, a difference of 0.020%), Immigrants from Sri Lanka (11.5%, a difference of 0.030%), Australian (11.5%, a difference of 0.050%), Immigrants from Bulgaria (11.5%, a difference of 0.070%), and Aleut (11.5%, a difference of 0.15%).
| Demographics | Rating | Rank | Seniors Poverty Over the Age of 75 |
| Basques | 95.1 /100 | #81 | Exceptional 11.5% |
| Iranians | 95.1 /100 | #82 | Exceptional 11.5% |
| Immigrants | South Africa | 94.9 /100 | #83 | Exceptional 11.5% |
| Immigrants | Iraq | 94.9 /100 | #84 | Exceptional 11.5% |
| Immigrants | Bulgaria | 94.7 /100 | #85 | Exceptional 11.5% |
| Australians | 94.6 /100 | #86 | Exceptional 11.5% |
| Koreans | 94.5 /100 | #87 | Exceptional 11.5% |
| Immigrants | Croatia | 94.5 /100 | #88 | Exceptional 11.5% |
| Immigrants | Sri Lanka | 94.4 /100 | #89 | Exceptional 11.5% |
| Aleuts | 94.1 /100 | #90 | Exceptional 11.5% |
| Immigrants | Germany | 94.1 /100 | #91 | Exceptional 11.5% |
| Kenyans | 93.9 /100 | #92 | Exceptional 11.5% |
| Immigrants | Poland | 92.9 /100 | #93 | Exceptional 11.6% |
| Creek | 92.7 /100 | #94 | Exceptional 11.6% |
| Immigrants | Bosnia and Herzegovina | 92.6 /100 | #95 | Exceptional 11.6% |
Demographics Similar to Immigrants from Central America by Seniors Poverty Over the Age of 75
In terms of seniors poverty over the age of 75, the demographic groups most similar to Immigrants from Central America are Immigrants from Mexico (14.9%, a difference of 0.33%), Cheyenne (14.9%, a difference of 0.53%), Immigrants from Guatemala (15.1%, a difference of 0.59%), Guatemalan (14.8%, a difference of 1.2%), and Jamaican (15.1%, a difference of 1.2%).
| Demographics | Rating | Rank | Seniors Poverty Over the Age of 75 |
| Blacks/African Americans | 0.0 /100 | #279 | Tragic 14.6% |
| Central Americans | 0.0 /100 | #280 | Tragic 14.7% |
| Belizeans | 0.0 /100 | #281 | Tragic 14.8% |
| Immigrants | Senegal | 0.0 /100 | #282 | Tragic 14.8% |
| Guatemalans | 0.0 /100 | #283 | Tragic 14.8% |
| Cheyenne | 0.0 /100 | #284 | Tragic 14.9% |
| Immigrants | Mexico | 0.0 /100 | #285 | Tragic 14.9% |
| Immigrants | Central America | 0.0 /100 | #286 | Tragic 15.0% |
| Immigrants | Guatemala | 0.0 /100 | #287 | Tragic 15.1% |
| Jamaicans | 0.0 /100 | #288 | Tragic 15.1% |
| Immigrants | Belize | 0.0 /100 | #289 | Tragic 15.2% |
| Immigrants | Azores | 0.0 /100 | #290 | Tragic 15.2% |
| Paiute | 0.0 /100 | #291 | Tragic 15.2% |
| Colville | 0.0 /100 | #292 | Tragic 15.2% |
| Apache | 0.0 /100 | #293 | Tragic 15.3% |