Immigrants from Malaysia vs Asian 10th Grade
COMPARE
Immigrants from Malaysia
Asian
10th Grade
10th Grade Comparison
Immigrants from Malaysia
Asians
93.5%
10TH GRADE
28.0/ 100
METRIC RATING
192nd/ 347
METRIC RANK
93.5%
10TH GRADE
23.0/ 100
METRIC RATING
199th/ 347
METRIC RANK
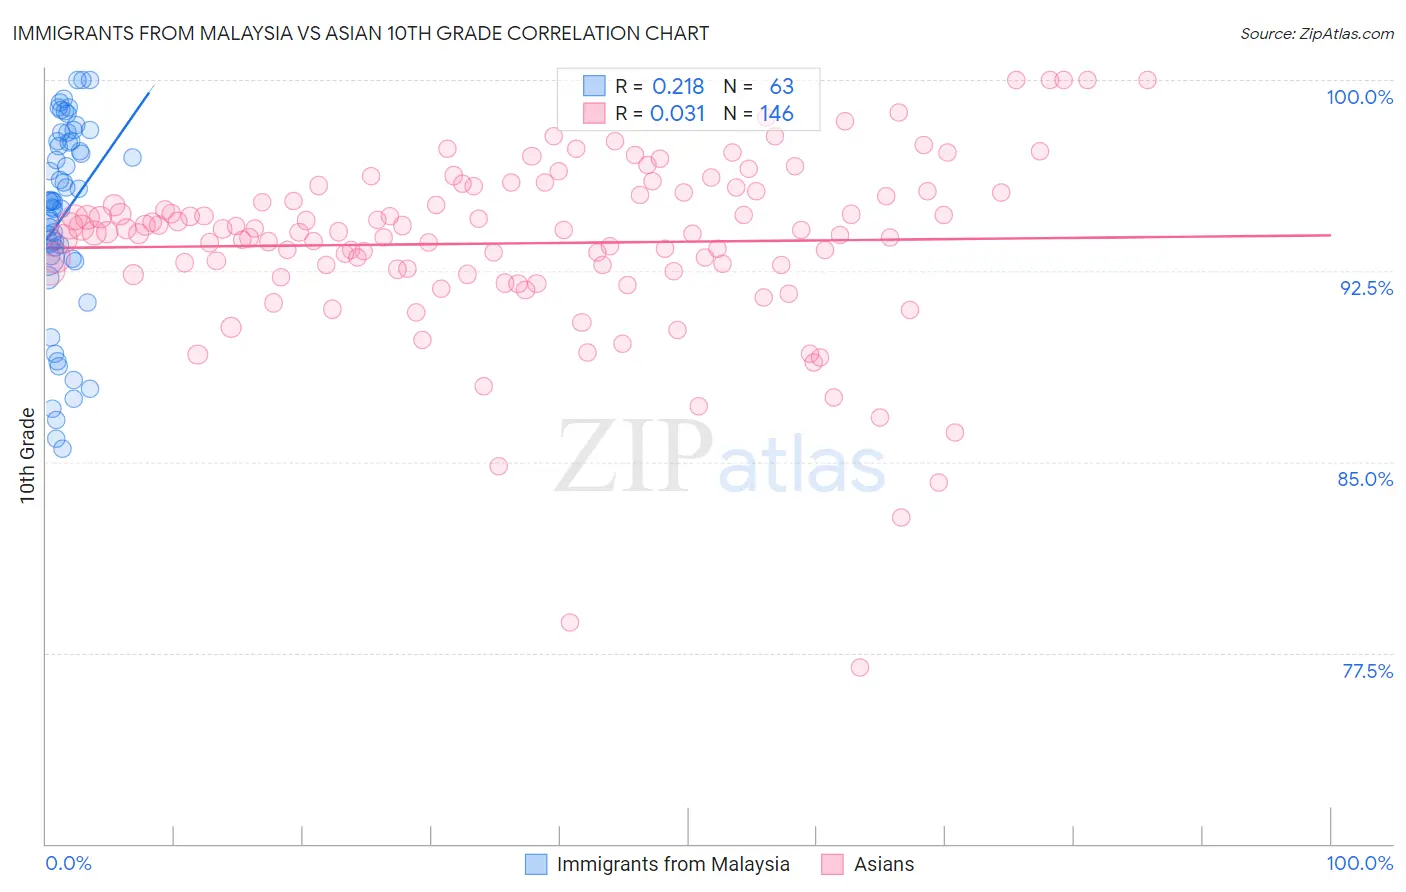
Immigrants from Malaysia vs Asian 10th Grade Correlation Chart
The statistical analysis conducted on geographies consisting of 197,867,328 people shows a weak positive correlation between the proportion of Immigrants from Malaysia and percentage of population with at least 10th grade education in the United States with a correlation coefficient (R) of 0.218 and weighted average of 93.5%. Similarly, the statistical analysis conducted on geographies consisting of 550,778,127 people shows no correlation between the proportion of Asians and percentage of population with at least 10th grade education in the United States with a correlation coefficient (R) of 0.031 and weighted average of 93.5%, a difference of 0.060%.
10th Grade Correlation Summary
| Measurement | Immigrants from Malaysia | Asian |
| Minimum | 85.5% | 76.9% |
| Maximum | 100.0% | 100.0% |
| Range | 14.5% | 23.1% |
| Mean | 94.7% | 93.6% |
| Median | 95.2% | 94.0% |
| Interquartile 25% (IQ1) | 93.0% | 92.5% |
| Interquartile 75% (IQ3) | 97.6% | 95.6% |
| Interquartile Range (IQR) | 4.6% | 3.1% |
| Standard Deviation (Sample) | 3.8% | 3.5% |
| Standard Deviation (Population) | 3.8% | 3.5% |
Demographics Similar to Immigrants from Malaysia and Asians by 10th Grade
In terms of 10th grade, the demographic groups most similar to Immigrants from Malaysia are Panamanian (93.5%, a difference of 0.0%), Immigrants from Morocco (93.5%, a difference of 0.010%), Cheyenne (93.5%, a difference of 0.010%), Yup'ik (93.6%, a difference of 0.030%), and Moroccan (93.5%, a difference of 0.030%). Similarly, the demographic groups most similar to Asians are Immigrants from Micronesia (93.5%, a difference of 0.0%), Pueblo (93.5%, a difference of 0.010%), Hopi (93.5%, a difference of 0.010%), Hawaiian (93.5%, a difference of 0.020%), and Moroccan (93.5%, a difference of 0.030%).
| Demographics | Rating | Rank | 10th Grade |
| Sudanese | 36.6 /100 | #185 | Fair 93.6% |
| Immigrants | Eastern Asia | 35.1 /100 | #186 | Fair 93.6% |
| Liberians | 34.7 /100 | #187 | Fair 93.6% |
| Marshallese | 33.2 /100 | #188 | Fair 93.6% |
| Immigrants | Pakistan | 32.5 /100 | #189 | Fair 93.6% |
| Laotians | 32.1 /100 | #190 | Fair 93.6% |
| Yup'ik | 31.1 /100 | #191 | Fair 93.6% |
| Immigrants | Malaysia | 28.0 /100 | #192 | Fair 93.5% |
| Panamanians | 28.0 /100 | #193 | Fair 93.5% |
| Immigrants | Morocco | 26.9 /100 | #194 | Fair 93.5% |
| Cheyenne | 26.8 /100 | #195 | Fair 93.5% |
| Moroccans | 25.3 /100 | #196 | Fair 93.5% |
| Pueblo | 23.9 /100 | #197 | Fair 93.5% |
| Immigrants | Micronesia | 23.2 /100 | #198 | Fair 93.5% |
| Asians | 23.0 /100 | #199 | Fair 93.5% |
| Hopi | 22.2 /100 | #200 | Fair 93.5% |
| Hawaiians | 21.8 /100 | #201 | Fair 93.5% |
| Immigrants | Uganda | 20.9 /100 | #202 | Fair 93.5% |
| Immigrants | Western Asia | 20.6 /100 | #203 | Fair 93.4% |
| Ute | 20.3 /100 | #204 | Fair 93.4% |
| Immigrants | Indonesia | 20.2 /100 | #205 | Fair 93.4% |