Immigrants from Liberia vs Zimbabwean Single Male Poverty
COMPARE
Immigrants from Liberia
Zimbabwean
Single Male Poverty
Single Male Poverty Comparison
Immigrants from Liberia
Zimbabweans
12.7%
SINGLE MALE POVERTY
64.2/ 100
METRIC RATING
159th/ 347
METRIC RANK
13.1%
SINGLE MALE POVERTY
14.9/ 100
METRIC RATING
214th/ 347
METRIC RANK
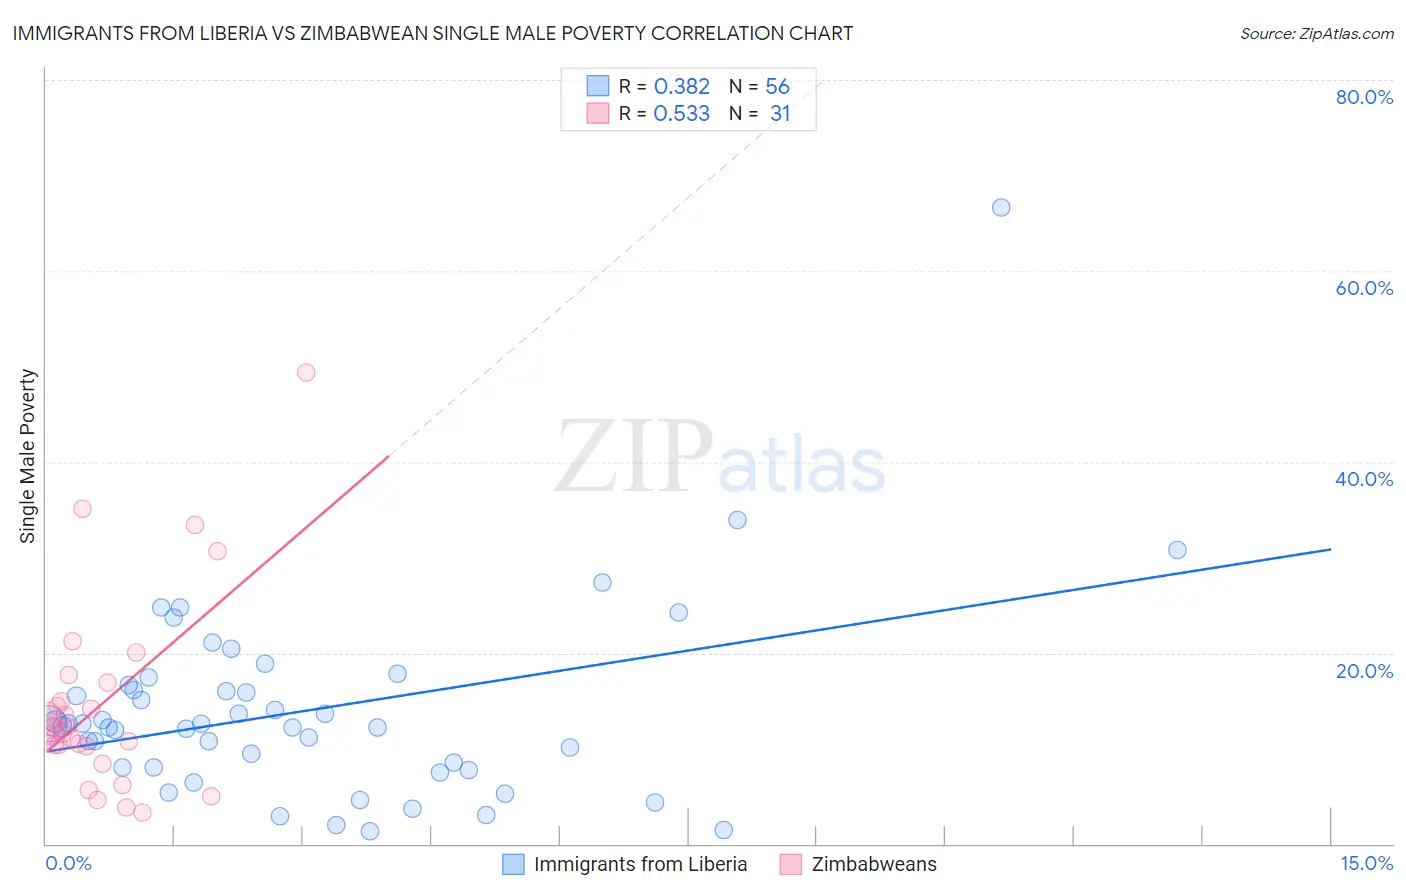
Immigrants from Liberia vs Zimbabwean Single Male Poverty Correlation Chart
The statistical analysis conducted on geographies consisting of 128,507,837 people shows a mild positive correlation between the proportion of Immigrants from Liberia and poverty level among single males in the United States with a correlation coefficient (R) of 0.382 and weighted average of 12.7%. Similarly, the statistical analysis conducted on geographies consisting of 66,821,414 people shows a substantial positive correlation between the proportion of Zimbabweans and poverty level among single males in the United States with a correlation coefficient (R) of 0.533 and weighted average of 13.1%, a difference of 3.1%.
Single Male Poverty Correlation Summary
| Measurement | Immigrants from Liberia | Zimbabwean |
| Minimum | 1.3% | 3.2% |
| Maximum | 66.7% | 49.4% |
| Range | 65.4% | 46.2% |
| Mean | 13.9% | 14.7% |
| Median | 12.4% | 12.2% |
| Interquartile 25% (IQ1) | 8.0% | 10.2% |
| Interquartile 75% (IQ3) | 16.4% | 16.9% |
| Interquartile Range (IQR) | 8.3% | 6.7% |
| Standard Deviation (Sample) | 10.2% | 10.2% |
| Standard Deviation (Population) | 10.1% | 10.0% |
Similar Demographics by Single Male Poverty
Demographics Similar to Immigrants from Liberia by Single Male Poverty
In terms of single male poverty, the demographic groups most similar to Immigrants from Liberia are Greek (12.7%, a difference of 0.0%), Immigrants from Middle Africa (12.7%, a difference of 0.040%), Immigrants from Africa (12.7%, a difference of 0.040%), Eastern European (12.7%, a difference of 0.050%), and Palestinian (12.7%, a difference of 0.060%).
| Demographics | Rating | Rank | Single Male Poverty |
| Australians | 71.4 /100 | #152 | Good 12.6% |
| Immigrants | Immigrants | 70.1 /100 | #153 | Good 12.7% |
| Immigrants | Scotland | 68.9 /100 | #154 | Good 12.7% |
| Immigrants | Spain | 68.7 /100 | #155 | Good 12.7% |
| Vietnamese | 67.9 /100 | #156 | Good 12.7% |
| Latvians | 67.9 /100 | #157 | Good 12.7% |
| Immigrants | Middle Africa | 64.9 /100 | #158 | Good 12.7% |
| Immigrants | Liberia | 64.2 /100 | #159 | Good 12.7% |
| Greeks | 64.1 /100 | #160 | Good 12.7% |
| Immigrants | Africa | 63.4 /100 | #161 | Good 12.7% |
| Eastern Europeans | 63.3 /100 | #162 | Good 12.7% |
| Palestinians | 63.1 /100 | #163 | Good 12.7% |
| Immigrants | Nigeria | 62.8 /100 | #164 | Good 12.7% |
| Immigrants | Cambodia | 62.2 /100 | #165 | Good 12.7% |
| Immigrants | Guyana | 60.5 /100 | #166 | Good 12.7% |
Demographics Similar to Zimbabweans by Single Male Poverty
In terms of single male poverty, the demographic groups most similar to Zimbabweans are Japanese (13.1%, a difference of 0.010%), Italian (13.1%, a difference of 0.090%), Austrian (13.1%, a difference of 0.10%), Senegalese (13.1%, a difference of 0.15%), and Swedish (13.1%, a difference of 0.18%).
| Demographics | Rating | Rank | Single Male Poverty |
| Sudanese | 17.7 /100 | #207 | Poor 13.1% |
| Immigrants | Western Africa | 17.6 /100 | #208 | Poor 13.1% |
| Mexican American Indians | 17.5 /100 | #209 | Poor 13.1% |
| Immigrants | Haiti | 16.8 /100 | #210 | Poor 13.1% |
| Swedes | 16.8 /100 | #211 | Poor 13.1% |
| Senegalese | 16.4 /100 | #212 | Poor 13.1% |
| Italians | 15.9 /100 | #213 | Poor 13.1% |
| Zimbabweans | 14.9 /100 | #214 | Poor 13.1% |
| Japanese | 14.8 /100 | #215 | Poor 13.1% |
| Austrians | 13.9 /100 | #216 | Poor 13.1% |
| Bermudans | 13.0 /100 | #217 | Poor 13.1% |
| Scandinavians | 12.9 /100 | #218 | Poor 13.1% |
| Immigrants | Burma/Myanmar | 12.6 /100 | #219 | Poor 13.1% |
| Central Americans | 10.9 /100 | #220 | Poor 13.2% |
| New Zealanders | 10.7 /100 | #221 | Poor 13.2% |