Immigrants from Latvia vs Latvian Female Poverty Among 25-34 Year Olds
COMPARE
Immigrants from Latvia
Latvian
Female Poverty Among 25-34 Year Olds
Female Poverty Among 25-34 Year Olds Comparison
Immigrants from Latvia
Latvians
12.5%
FEMALE POVERTY AMONG 25-34 YEAR OLDS
97.7/ 100
METRIC RATING
84th/ 347
METRIC RANK
11.8%
FEMALE POVERTY AMONG 25-34 YEAR OLDS
99.8/ 100
METRIC RATING
39th/ 347
METRIC RANK
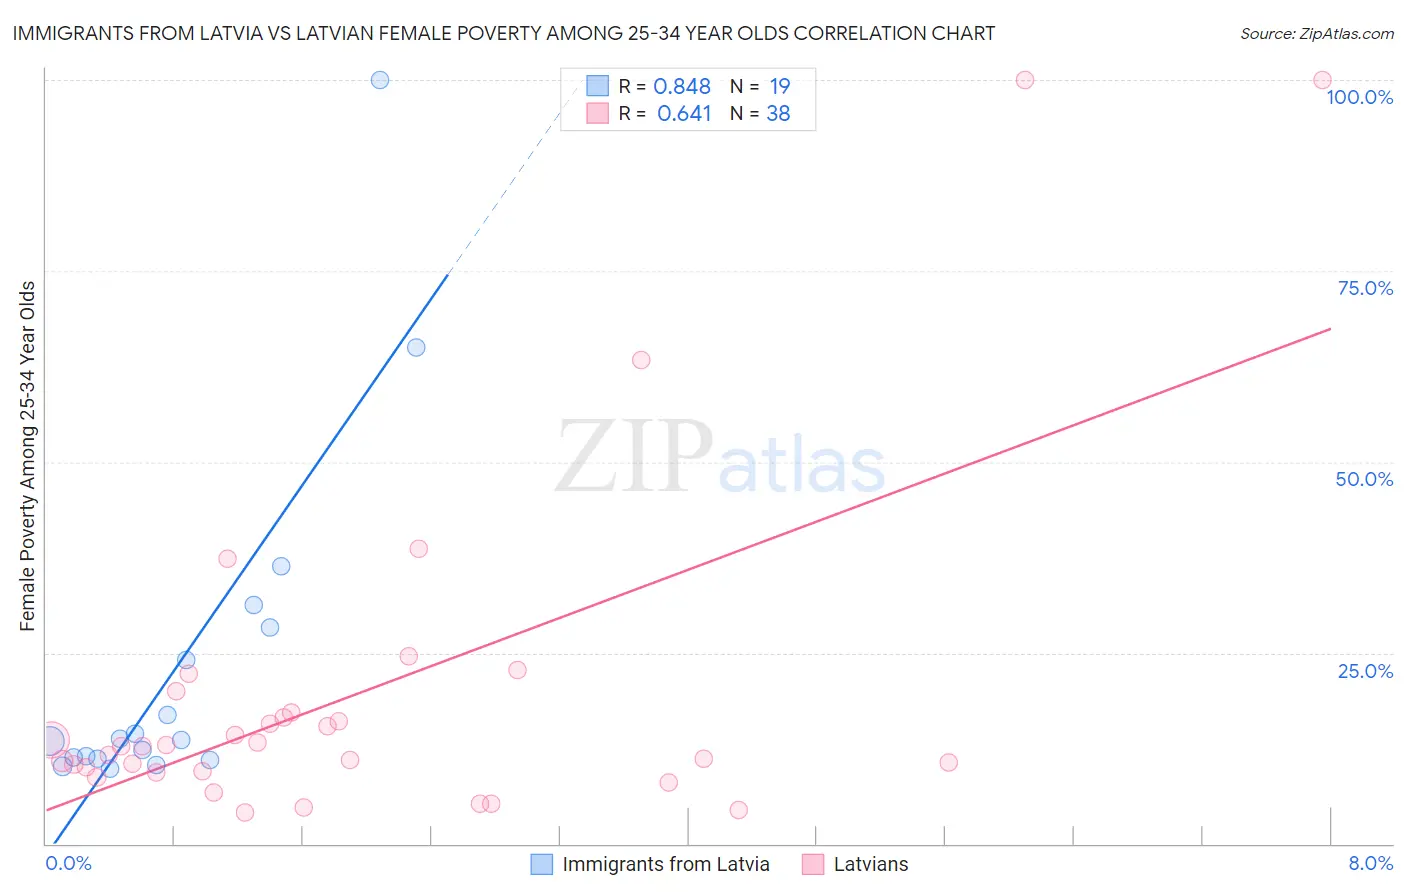
Immigrants from Latvia vs Latvian Female Poverty Among 25-34 Year Olds Correlation Chart
The statistical analysis conducted on geographies consisting of 113,031,058 people shows a very strong positive correlation between the proportion of Immigrants from Latvia and poverty level among females between the ages 25 and 34 in the United States with a correlation coefficient (R) of 0.848 and weighted average of 12.5%. Similarly, the statistical analysis conducted on geographies consisting of 217,585,709 people shows a significant positive correlation between the proportion of Latvians and poverty level among females between the ages 25 and 34 in the United States with a correlation coefficient (R) of 0.641 and weighted average of 11.8%, a difference of 5.7%.
Female Poverty Among 25-34 Year Olds Correlation Summary
| Measurement | Immigrants from Latvia | Latvian |
| Minimum | 9.8% | 4.1% |
| Maximum | 100.0% | 100.0% |
| Range | 90.2% | 95.9% |
| Mean | 23.4% | 19.5% |
| Median | 13.6% | 12.7% |
| Interquartile 25% (IQ1) | 11.1% | 9.5% |
| Interquartile 75% (IQ3) | 28.4% | 17.2% |
| Interquartile Range (IQR) | 17.3% | 7.6% |
| Standard Deviation (Sample) | 23.0% | 22.2% |
| Standard Deviation (Population) | 22.4% | 21.9% |
Similar Demographics by Female Poverty Among 25-34 Year Olds
Demographics Similar to Immigrants from Latvia by Female Poverty Among 25-34 Year Olds
In terms of female poverty among 25-34 year olds, the demographic groups most similar to Immigrants from Latvia are Albanian (12.5%, a difference of 0.060%), Immigrants from South Eastern Asia (12.5%, a difference of 0.11%), Croatian (12.5%, a difference of 0.13%), Argentinean (12.5%, a difference of 0.15%), and Immigrants from Austria (12.5%, a difference of 0.23%).
| Demographics | Rating | Rank | Female Poverty Among 25-34 Year Olds |
| Immigrants | Italy | 98.8 /100 | #77 | Exceptional 12.3% |
| Immigrants | Ukraine | 98.6 /100 | #78 | Exceptional 12.3% |
| Immigrants | Jordan | 98.5 /100 | #79 | Exceptional 12.4% |
| Immigrants | Malaysia | 98.3 /100 | #80 | Exceptional 12.4% |
| Immigrants | Kazakhstan | 98.1 /100 | #81 | Exceptional 12.4% |
| Ethiopians | 98.0 /100 | #82 | Exceptional 12.4% |
| Albanians | 97.7 /100 | #83 | Exceptional 12.5% |
| Immigrants | Latvia | 97.7 /100 | #84 | Exceptional 12.5% |
| Immigrants | South Eastern Asia | 97.6 /100 | #85 | Exceptional 12.5% |
| Croatians | 97.5 /100 | #86 | Exceptional 12.5% |
| Argentineans | 97.5 /100 | #87 | Exceptional 12.5% |
| Immigrants | Austria | 97.4 /100 | #88 | Exceptional 12.5% |
| Italians | 97.2 /100 | #89 | Exceptional 12.5% |
| Immigrants | Albania | 97.1 /100 | #90 | Exceptional 12.5% |
| Norwegians | 96.9 /100 | #91 | Exceptional 12.6% |
Demographics Similar to Latvians by Female Poverty Among 25-34 Year Olds
In terms of female poverty among 25-34 year olds, the demographic groups most similar to Latvians are Immigrants from Bulgaria (11.8%, a difference of 0.16%), Immigrants from North Macedonia (11.8%, a difference of 0.25%), Immigrants from Indonesia (11.8%, a difference of 0.29%), Taiwanese (11.8%, a difference of 0.32%), and Immigrants from Sri Lanka (11.8%, a difference of 0.48%).
| Demographics | Rating | Rank | Female Poverty Among 25-34 Year Olds |
| Immigrants | Asia | 99.9 /100 | #32 | Exceptional 11.6% |
| Immigrants | Poland | 99.9 /100 | #33 | Exceptional 11.6% |
| Zimbabweans | 99.9 /100 | #34 | Exceptional 11.7% |
| Cambodians | 99.9 /100 | #35 | Exceptional 11.7% |
| Immigrants | Sri Lanka | 99.8 /100 | #36 | Exceptional 11.8% |
| Taiwanese | 99.8 /100 | #37 | Exceptional 11.8% |
| Immigrants | North Macedonia | 99.8 /100 | #38 | Exceptional 11.8% |
| Latvians | 99.8 /100 | #39 | Exceptional 11.8% |
| Immigrants | Bulgaria | 99.8 /100 | #40 | Exceptional 11.8% |
| Immigrants | Indonesia | 99.8 /100 | #41 | Exceptional 11.8% |
| Immigrants | Turkey | 99.7 /100 | #42 | Exceptional 11.9% |
| Egyptians | 99.7 /100 | #43 | Exceptional 11.9% |
| Immigrants | Australia | 99.7 /100 | #44 | Exceptional 11.9% |
| Macedonians | 99.7 /100 | #45 | Exceptional 11.9% |
| Immigrants | Serbia | 99.7 /100 | #46 | Exceptional 11.9% |