Immigrants from Latvia vs Immigrants from Romania Median Family Income
COMPARE
Immigrants from Latvia
Immigrants from Romania
Median Family Income
Median Family Income Comparison
Immigrants from Latvia
Immigrants from Romania
$114,826
MEDIAN FAMILY INCOME
99.8/ 100
METRIC RATING
60th/ 347
METRIC RANK
$113,434
MEDIAN FAMILY INCOME
99.6/ 100
METRIC RATING
70th/ 347
METRIC RANK
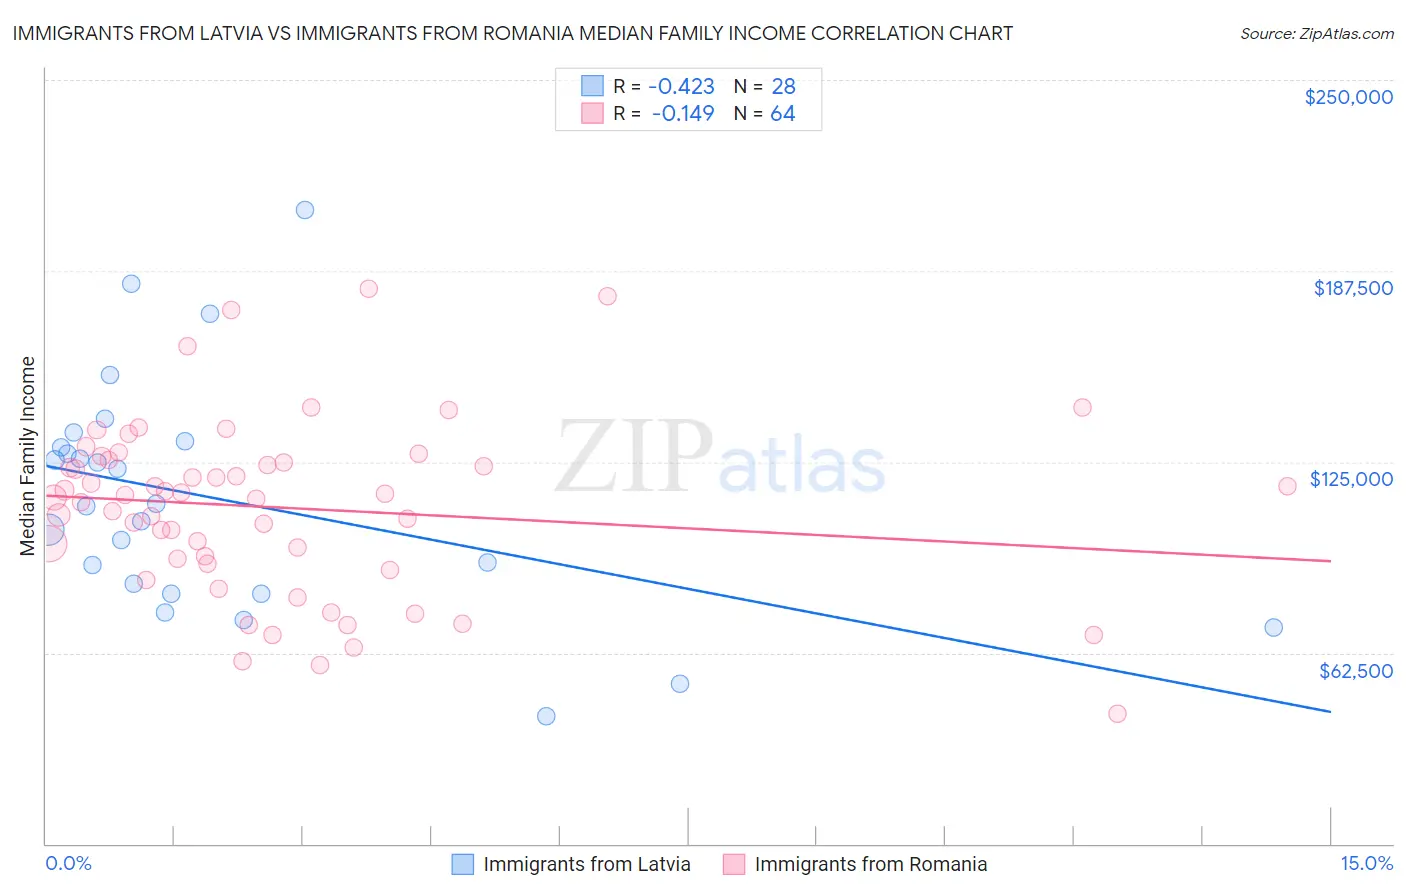
Immigrants from Latvia vs Immigrants from Romania Median Family Income Correlation Chart
The statistical analysis conducted on geographies consisting of 113,722,830 people shows a moderate negative correlation between the proportion of Immigrants from Latvia and median family income in the United States with a correlation coefficient (R) of -0.423 and weighted average of $114,826. Similarly, the statistical analysis conducted on geographies consisting of 256,919,145 people shows a poor negative correlation between the proportion of Immigrants from Romania and median family income in the United States with a correlation coefficient (R) of -0.149 and weighted average of $113,434, a difference of 1.2%.
Median Family Income Correlation Summary
| Measurement | Immigrants from Latvia | Immigrants from Romania |
| Minimum | $41,641 | $42,500 |
| Maximum | $207,328 | $181,711 |
| Range | $165,687 | $139,211 |
| Mean | $112,663 | $109,959 |
| Median | $110,782 | $113,781 |
| Interquartile 25% (IQ1) | $83,546 | $92,391 |
| Interquartile 75% (IQ3) | $130,754 | $125,210 |
| Interquartile Range (IQR) | $47,207 | $32,820 |
| Standard Deviation (Sample) | $38,081 | $28,709 |
| Standard Deviation (Population) | $37,395 | $28,484 |
Demographics Similar to Immigrants from Latvia and Immigrants from Romania by Median Family Income
In terms of median family income, the demographic groups most similar to Immigrants from Latvia are Immigrants from Netherlands ($114,987, a difference of 0.14%), Immigrants from Belarus ($114,586, a difference of 0.21%), Mongolian ($114,553, a difference of 0.24%), Immigrants from Indonesia ($115,162, a difference of 0.29%), and Greek ($115,192, a difference of 0.32%). Similarly, the demographic groups most similar to Immigrants from Romania are Immigrants from Bulgaria ($113,461, a difference of 0.020%), Immigrants from Serbia ($113,463, a difference of 0.030%), South African ($113,229, a difference of 0.18%), Immigrants from Spain ($113,815, a difference of 0.34%), and Afghan ($112,971, a difference of 0.41%).
| Demographics | Rating | Rank | Median Family Income |
| Lithuanians | 99.8 /100 | #55 | Exceptional $115,395 |
| New Zealanders | 99.8 /100 | #56 | Exceptional $115,230 |
| Greeks | 99.8 /100 | #57 | Exceptional $115,192 |
| Immigrants | Indonesia | 99.8 /100 | #58 | Exceptional $115,162 |
| Immigrants | Netherlands | 99.8 /100 | #59 | Exceptional $114,987 |
| Immigrants | Latvia | 99.8 /100 | #60 | Exceptional $114,826 |
| Immigrants | Belarus | 99.8 /100 | #61 | Exceptional $114,586 |
| Mongolians | 99.8 /100 | #62 | Exceptional $114,553 |
| Immigrants | Pakistan | 99.8 /100 | #63 | Exceptional $114,406 |
| Immigrants | Scotland | 99.7 /100 | #64 | Exceptional $114,392 |
| Egyptians | 99.7 /100 | #65 | Exceptional $114,119 |
| Paraguayans | 99.7 /100 | #66 | Exceptional $114,016 |
| Immigrants | Spain | 99.7 /100 | #67 | Exceptional $113,815 |
| Immigrants | Serbia | 99.6 /100 | #68 | Exceptional $113,463 |
| Immigrants | Bulgaria | 99.6 /100 | #69 | Exceptional $113,461 |
| Immigrants | Romania | 99.6 /100 | #70 | Exceptional $113,434 |
| South Africans | 99.5 /100 | #71 | Exceptional $113,229 |
| Afghans | 99.5 /100 | #72 | Exceptional $112,971 |
| Laotians | 99.5 /100 | #73 | Exceptional $112,859 |
| Immigrants | Italy | 99.4 /100 | #74 | Exceptional $112,848 |
| Immigrants | Western Europe | 99.4 /100 | #75 | Exceptional $112,688 |