Immigrants from Latvia vs Immigrants from Uruguay Seniors Poverty Over the Age of 65
COMPARE
Immigrants from Latvia
Immigrants from Uruguay
Seniors Poverty Over the Age of 65
Seniors Poverty Over the Age of 65 Comparison
Immigrants from Latvia
Immigrants from Uruguay
10.5%
SENIORS POVERTY OVER THE AGE OF 65
84.7/ 100
METRIC RATING
138th/ 347
METRIC RANK
12.8%
SENIORS POVERTY OVER THE AGE OF 65
0.1/ 100
METRIC RATING
272nd/ 347
METRIC RANK
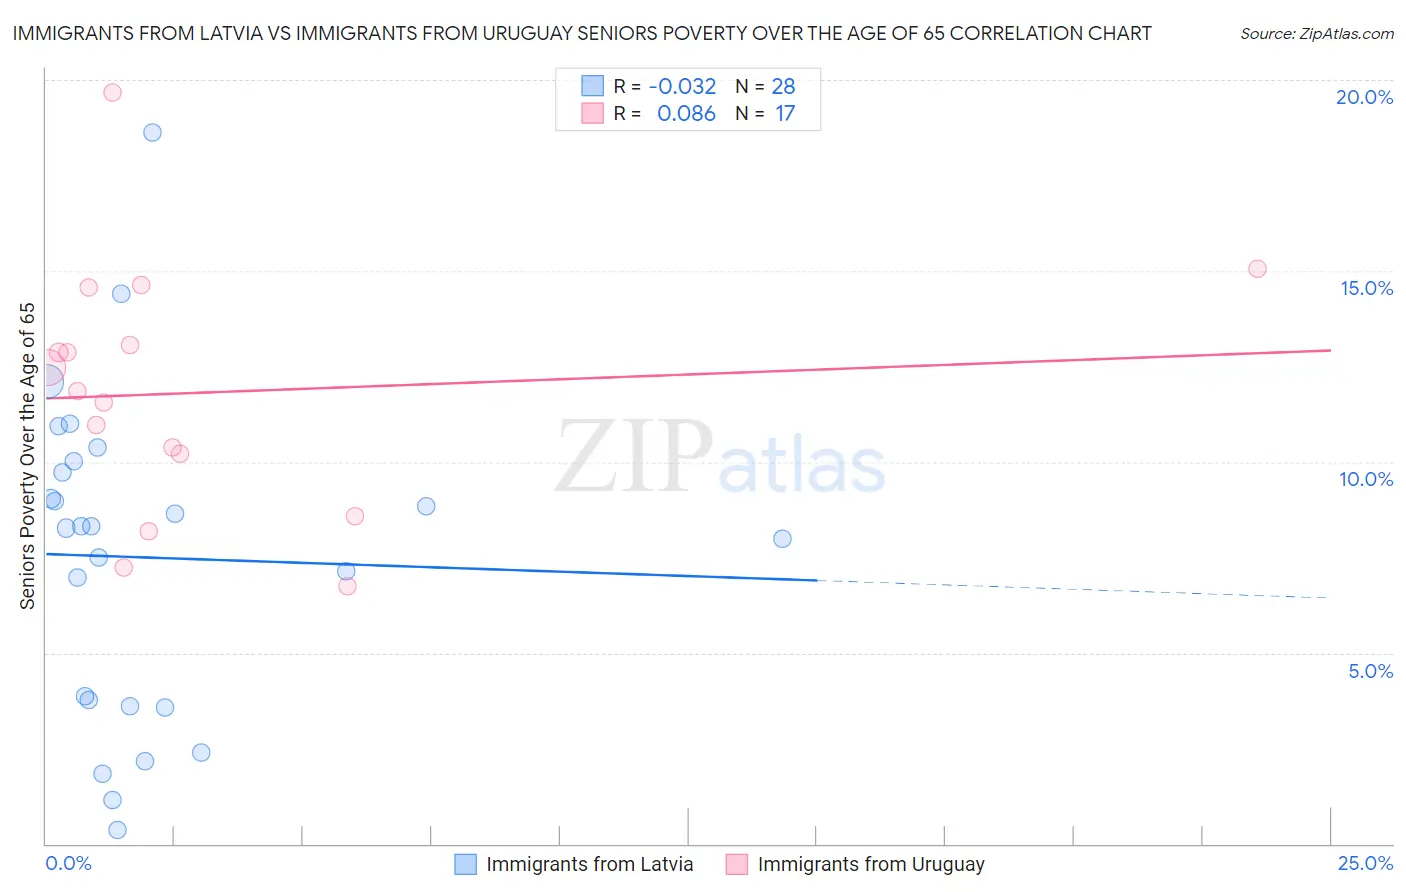
Immigrants from Latvia vs Immigrants from Uruguay Seniors Poverty Over the Age of 65 Correlation Chart
The statistical analysis conducted on geographies consisting of 113,653,764 people shows no correlation between the proportion of Immigrants from Latvia and poverty level among seniors over the age of 65 in the United States with a correlation coefficient (R) of -0.032 and weighted average of 10.5%. Similarly, the statistical analysis conducted on geographies consisting of 133,160,147 people shows a slight positive correlation between the proportion of Immigrants from Uruguay and poverty level among seniors over the age of 65 in the United States with a correlation coefficient (R) of 0.086 and weighted average of 12.8%, a difference of 21.4%.
Seniors Poverty Over the Age of 65 Correlation Summary
| Measurement | Immigrants from Latvia | Immigrants from Uruguay |
| Minimum | 0.37% | 6.7% |
| Maximum | 18.6% | 19.7% |
| Range | 18.3% | 12.9% |
| Mean | 7.5% | 11.8% |
| Median | 8.3% | 11.8% |
| Interquartile 25% (IQ1) | 3.7% | 9.4% |
| Interquartile 75% (IQ3) | 9.9% | 13.8% |
| Interquartile Range (IQR) | 6.2% | 4.4% |
| Standard Deviation (Sample) | 4.2% | 3.2% |
| Standard Deviation (Population) | 4.2% | 3.1% |
Similar Demographics by Seniors Poverty Over the Age of 65
Demographics Similar to Immigrants from Latvia by Seniors Poverty Over the Age of 65
In terms of seniors poverty over the age of 65, the demographic groups most similar to Immigrants from Latvia are Immigrants from Australia (10.5%, a difference of 0.060%), Portuguese (10.5%, a difference of 0.10%), Immigrants from Kenya (10.5%, a difference of 0.23%), Immigrants from Europe (10.5%, a difference of 0.25%), and Immigrants from Serbia (10.5%, a difference of 0.32%).
| Demographics | Rating | Rank | Seniors Poverty Over the Age of 65 |
| Egyptians | 87.8 /100 | #131 | Excellent 10.5% |
| Immigrants | Turkey | 87.7 /100 | #132 | Excellent 10.5% |
| Guamanians/Chamorros | 87.5 /100 | #133 | Excellent 10.5% |
| Sierra Leoneans | 86.8 /100 | #134 | Excellent 10.5% |
| Immigrants | Norway | 86.5 /100 | #135 | Excellent 10.5% |
| Immigrants | Serbia | 86.4 /100 | #136 | Excellent 10.5% |
| Immigrants | Australia | 85.1 /100 | #137 | Excellent 10.5% |
| Immigrants | Latvia | 84.7 /100 | #138 | Excellent 10.5% |
| Portuguese | 84.1 /100 | #139 | Excellent 10.5% |
| Immigrants | Kenya | 83.4 /100 | #140 | Excellent 10.5% |
| Immigrants | Europe | 83.3 /100 | #141 | Excellent 10.5% |
| Osage | 82.8 /100 | #142 | Excellent 10.6% |
| Immigrants | Asia | 80.8 /100 | #143 | Excellent 10.6% |
| Iraqis | 80.7 /100 | #144 | Excellent 10.6% |
| Laotians | 79.9 /100 | #145 | Good 10.6% |
Demographics Similar to Immigrants from Uruguay by Seniors Poverty Over the Age of 65
In terms of seniors poverty over the age of 65, the demographic groups most similar to Immigrants from Uruguay are Immigrants from Ghana (12.8%, a difference of 0.030%), Kiowa (12.8%, a difference of 0.12%), Immigrants from South America (12.7%, a difference of 0.30%), Salvadoran (12.8%, a difference of 0.37%), and Immigrants from Venezuela (12.7%, a difference of 0.55%).
| Demographics | Rating | Rank | Seniors Poverty Over the Age of 65 |
| Immigrants | Western Africa | 0.1 /100 | #265 | Tragic 12.6% |
| Africans | 0.1 /100 | #266 | Tragic 12.6% |
| Blackfeet | 0.1 /100 | #267 | Tragic 12.6% |
| Immigrants | Somalia | 0.1 /100 | #268 | Tragic 12.6% |
| Immigrants | Venezuela | 0.1 /100 | #269 | Tragic 12.7% |
| Immigrants | South America | 0.1 /100 | #270 | Tragic 12.7% |
| Immigrants | Ghana | 0.1 /100 | #271 | Tragic 12.8% |
| Immigrants | Uruguay | 0.1 /100 | #272 | Tragic 12.8% |
| Kiowa | 0.0 /100 | #273 | Tragic 12.8% |
| Salvadorans | 0.0 /100 | #274 | Tragic 12.8% |
| Immigrants | Colombia | 0.0 /100 | #275 | Tragic 12.9% |
| Immigrants | Azores | 0.0 /100 | #276 | Tragic 12.9% |
| Paiute | 0.0 /100 | #277 | Tragic 12.9% |
| Immigrants | Bahamas | 0.0 /100 | #278 | Tragic 13.0% |
| Mexicans | 0.0 /100 | #279 | Tragic 13.1% |