Immigrants from Eritrea vs Lebanese Child Poverty Under the Age of 5
COMPARE
Immigrants from Eritrea
Lebanese
Child Poverty Under the Age of 5
Child Poverty Under the Age of 5 Comparison
Immigrants from Eritrea
Lebanese
19.1%
CHILD POVERTY UNDER THE AGE OF 5
1.5/ 100
METRIC RATING
226th/ 347
METRIC RANK
17.4%
CHILD POVERTY UNDER THE AGE OF 5
40.3/ 100
METRIC RATING
183rd/ 347
METRIC RANK
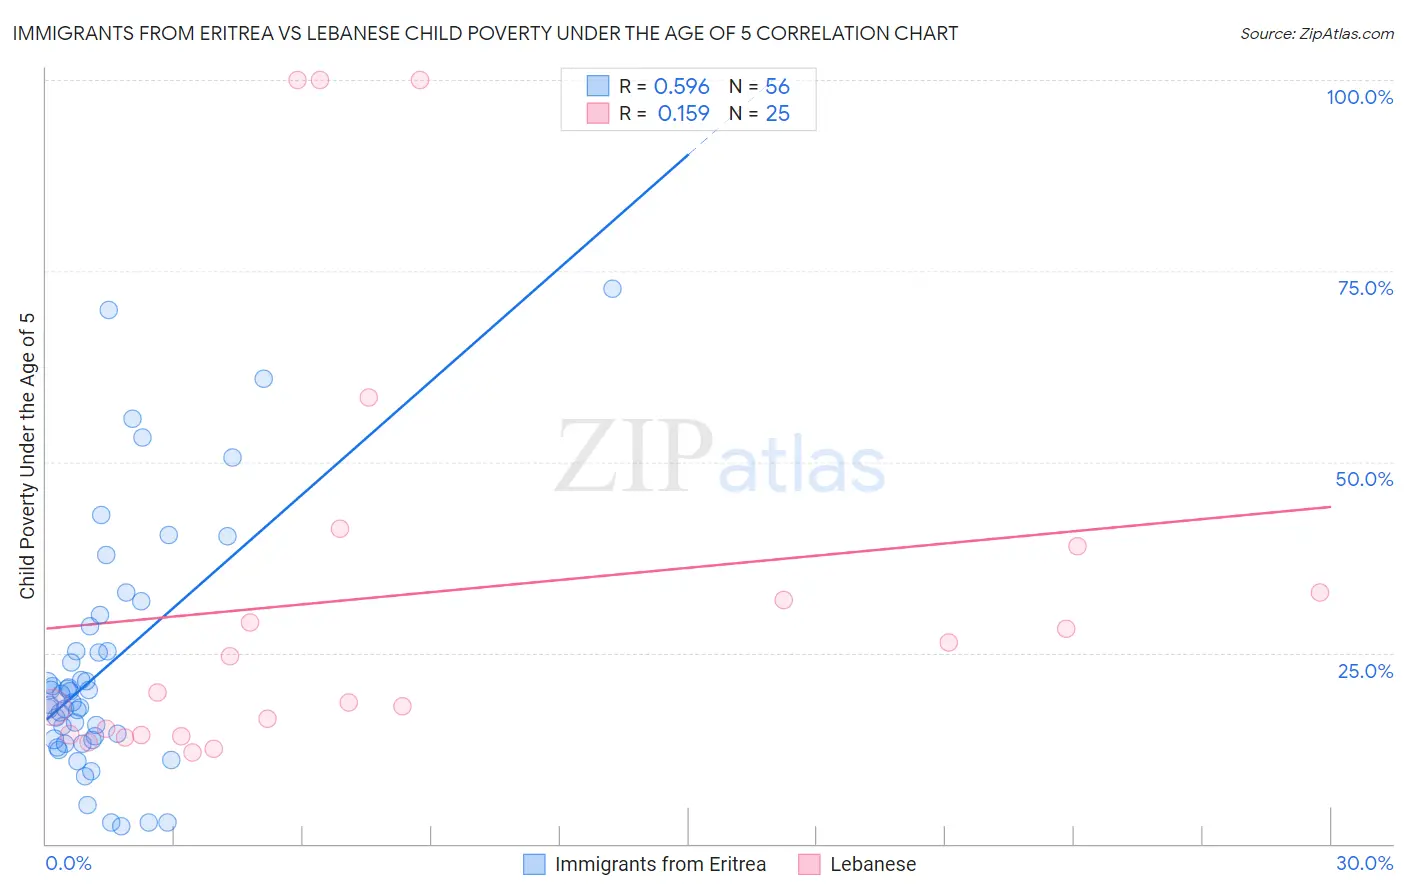
Immigrants from Eritrea vs Lebanese Child Poverty Under the Age of 5 Correlation Chart
The statistical analysis conducted on geographies consisting of 103,980,872 people shows a substantial positive correlation between the proportion of Immigrants from Eritrea and poverty level among children under the age of 5 in the United States with a correlation coefficient (R) of 0.596 and weighted average of 19.1%. Similarly, the statistical analysis conducted on geographies consisting of 383,569,611 people shows a poor positive correlation between the proportion of Lebanese and poverty level among children under the age of 5 in the United States with a correlation coefficient (R) of 0.159 and weighted average of 17.4%, a difference of 9.7%.
Child Poverty Under the Age of 5 Correlation Summary
| Measurement | Immigrants from Eritrea | Lebanese |
| Minimum | 2.3% | 12.0% |
| Maximum | 72.7% | 100.0% |
| Range | 70.4% | 88.0% |
| Mean | 23.3% | 32.4% |
| Median | 19.0% | 19.7% |
| Interquartile 25% (IQ1) | 13.6% | 14.2% |
| Interquartile 75% (IQ3) | 26.8% | 35.9% |
| Interquartile Range (IQR) | 13.2% | 21.6% |
| Standard Deviation (Sample) | 16.1% | 27.7% |
| Standard Deviation (Population) | 15.9% | 27.2% |
Similar Demographics by Child Poverty Under the Age of 5
Demographics Similar to Immigrants from Eritrea by Child Poverty Under the Age of 5
In terms of child poverty under the age of 5, the demographic groups most similar to Immigrants from Eritrea are Nigerian (19.1%, a difference of 0.020%), Nicaraguan (19.1%, a difference of 0.050%), Cuban (19.1%, a difference of 0.16%), Alsatian (19.1%, a difference of 0.18%), and Cape Verdean (19.1%, a difference of 0.18%).
| Demographics | Rating | Rank | Child Poverty Under the Age of 5 |
| German Russians | 3.0 /100 | #219 | Tragic 18.8% |
| Immigrants | Azores | 2.6 /100 | #220 | Tragic 18.9% |
| Immigrants | Nigeria | 2.1 /100 | #221 | Tragic 19.0% |
| Alsatians | 1.7 /100 | #222 | Tragic 19.1% |
| Cubans | 1.7 /100 | #223 | Tragic 19.1% |
| Nicaraguans | 1.6 /100 | #224 | Tragic 19.1% |
| Nigerians | 1.6 /100 | #225 | Tragic 19.1% |
| Immigrants | Eritrea | 1.5 /100 | #226 | Tragic 19.1% |
| Cape Verdeans | 1.4 /100 | #227 | Tragic 19.1% |
| Immigrants | Sudan | 1.3 /100 | #228 | Tragic 19.2% |
| Ghanaians | 1.2 /100 | #229 | Tragic 19.2% |
| Ecuadorians | 1.2 /100 | #230 | Tragic 19.2% |
| Bermudans | 1.2 /100 | #231 | Tragic 19.2% |
| Trinidadians and Tobagonians | 0.9 /100 | #232 | Tragic 19.3% |
| Sudanese | 0.9 /100 | #233 | Tragic 19.3% |
Demographics Similar to Lebanese by Child Poverty Under the Age of 5
In terms of child poverty under the age of 5, the demographic groups most similar to Lebanese are Arab (17.4%, a difference of 0.040%), Immigrants from Germany (17.4%, a difference of 0.070%), Hawaiian (17.4%, a difference of 0.12%), South American Indian (17.4%, a difference of 0.12%), and Immigrants from Costa Rica (17.4%, a difference of 0.14%).
| Demographics | Rating | Rank | Child Poverty Under the Age of 5 |
| Immigrants | Iraq | 45.2 /100 | #176 | Average 17.3% |
| Immigrants | Sierra Leone | 43.6 /100 | #177 | Average 17.3% |
| Immigrants | Cameroon | 42.7 /100 | #178 | Average 17.4% |
| Hawaiians | 41.5 /100 | #179 | Average 17.4% |
| South American Indians | 41.4 /100 | #180 | Average 17.4% |
| Immigrants | Germany | 41.0 /100 | #181 | Average 17.4% |
| Arabs | 40.7 /100 | #182 | Average 17.4% |
| Lebanese | 40.3 /100 | #183 | Average 17.4% |
| Immigrants | Costa Rica | 39.0 /100 | #184 | Fair 17.4% |
| Immigrants | Armenia | 38.0 /100 | #185 | Fair 17.5% |
| Immigrants | Bosnia and Herzegovina | 35.0 /100 | #186 | Fair 17.5% |
| Kenyans | 34.7 /100 | #187 | Fair 17.5% |
| Carpatho Rusyns | 33.6 /100 | #188 | Fair 17.5% |
| French | 33.6 /100 | #189 | Fair 17.5% |
| Slovaks | 29.2 /100 | #190 | Fair 17.6% |