Immigrants from Lebanon vs Lebanese Child Poverty Under the Age of 5
COMPARE
Immigrants from Lebanon
Lebanese
Child Poverty Under the Age of 5
Child Poverty Under the Age of 5 Comparison
Immigrants from Lebanon
Lebanese
17.3%
CHILD POVERTY UNDER THE AGE OF 5
47.6/ 100
METRIC RATING
175th/ 347
METRIC RANK
17.4%
CHILD POVERTY UNDER THE AGE OF 5
40.3/ 100
METRIC RATING
183rd/ 347
METRIC RANK
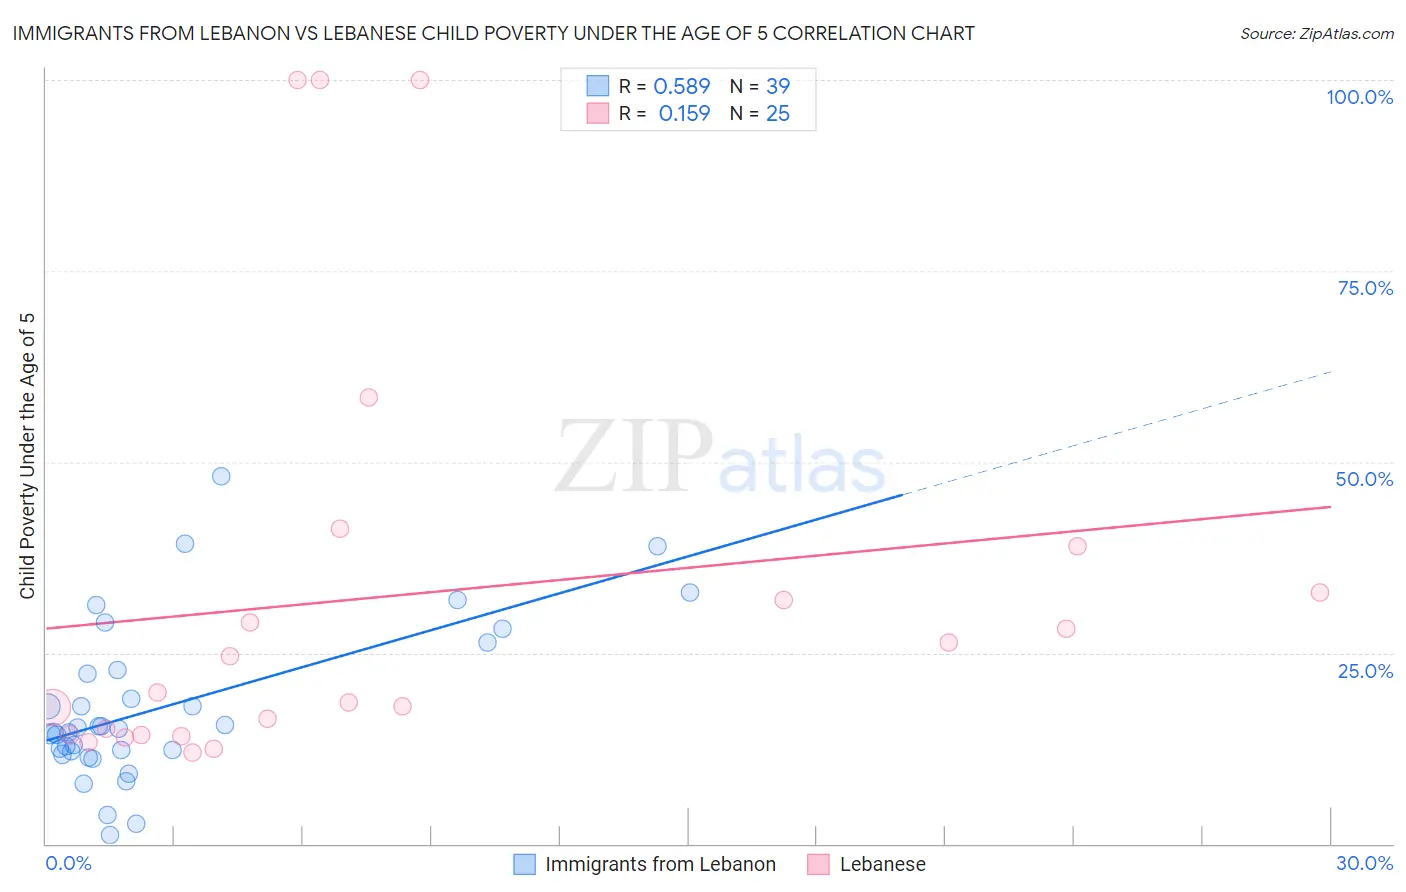
Immigrants from Lebanon vs Lebanese Child Poverty Under the Age of 5 Correlation Chart
The statistical analysis conducted on geographies consisting of 210,438,499 people shows a substantial positive correlation between the proportion of Immigrants from Lebanon and poverty level among children under the age of 5 in the United States with a correlation coefficient (R) of 0.589 and weighted average of 17.3%. Similarly, the statistical analysis conducted on geographies consisting of 383,569,611 people shows a poor positive correlation between the proportion of Lebanese and poverty level among children under the age of 5 in the United States with a correlation coefficient (R) of 0.159 and weighted average of 17.4%, a difference of 0.76%.
Child Poverty Under the Age of 5 Correlation Summary
| Measurement | Immigrants from Lebanon | Lebanese |
| Minimum | 1.2% | 12.0% |
| Maximum | 48.0% | 100.0% |
| Range | 46.9% | 88.0% |
| Mean | 17.9% | 32.4% |
| Median | 15.0% | 19.7% |
| Interquartile 25% (IQ1) | 12.1% | 14.2% |
| Interquartile 75% (IQ3) | 22.8% | 35.9% |
| Interquartile Range (IQR) | 10.7% | 21.6% |
| Standard Deviation (Sample) | 10.4% | 27.7% |
| Standard Deviation (Population) | 10.3% | 27.2% |
Demographics Similar to Immigrants from Lebanon and Lebanese by Child Poverty Under the Age of 5
In terms of child poverty under the age of 5, the demographic groups most similar to Immigrants from Lebanon are Immigrants from Saudi Arabia (17.2%, a difference of 0.25%), Immigrants from Iraq (17.3%, a difference of 0.25%), Immigrants from Sierra Leone (17.3%, a difference of 0.41%), Immigrants from Cameroon (17.4%, a difference of 0.51%), and Hawaiian (17.4%, a difference of 0.64%). Similarly, the demographic groups most similar to Lebanese are Arab (17.4%, a difference of 0.040%), Immigrants from Germany (17.4%, a difference of 0.070%), Hawaiian (17.4%, a difference of 0.12%), South American Indian (17.4%, a difference of 0.12%), and Immigrants from Costa Rica (17.4%, a difference of 0.14%).
| Demographics | Rating | Rank | Child Poverty Under the Age of 5 |
| Immigrants | South America | 60.0 /100 | #169 | Good 17.1% |
| Immigrants | Western Asia | 59.2 /100 | #170 | Average 17.1% |
| Immigrants | Morocco | 58.9 /100 | #171 | Average 17.1% |
| Yugoslavians | 54.1 /100 | #172 | Average 17.2% |
| Welsh | 54.0 /100 | #173 | Average 17.2% |
| Immigrants | Saudi Arabia | 50.0 /100 | #174 | Average 17.2% |
| Immigrants | Lebanon | 47.6 /100 | #175 | Average 17.3% |
| Immigrants | Iraq | 45.2 /100 | #176 | Average 17.3% |
| Immigrants | Sierra Leone | 43.6 /100 | #177 | Average 17.3% |
| Immigrants | Cameroon | 42.7 /100 | #178 | Average 17.4% |
| Hawaiians | 41.5 /100 | #179 | Average 17.4% |
| South American Indians | 41.4 /100 | #180 | Average 17.4% |
| Immigrants | Germany | 41.0 /100 | #181 | Average 17.4% |
| Arabs | 40.7 /100 | #182 | Average 17.4% |
| Lebanese | 40.3 /100 | #183 | Average 17.4% |
| Immigrants | Costa Rica | 39.0 /100 | #184 | Fair 17.4% |
| Immigrants | Armenia | 38.0 /100 | #185 | Fair 17.5% |
| Immigrants | Bosnia and Herzegovina | 35.0 /100 | #186 | Fair 17.5% |
| Kenyans | 34.7 /100 | #187 | Fair 17.5% |
| Carpatho Rusyns | 33.6 /100 | #188 | Fair 17.5% |
| French | 33.6 /100 | #189 | Fair 17.5% |