Immigrants from Latin America vs Israeli Seniors Poverty Over the Age of 75
COMPARE
Immigrants from Latin America
Israeli
Seniors Poverty Over the Age of 75
Seniors Poverty Over the Age of 75 Comparison
Immigrants from Latin America
Israelis
15.6%
SENIORS POVERTY OVER THE AGE OF 75
0.0/ 100
METRIC RATING
301st/ 347
METRIC RANK
13.2%
SENIORS POVERTY OVER THE AGE OF 75
2.0/ 100
METRIC RATING
228th/ 347
METRIC RANK
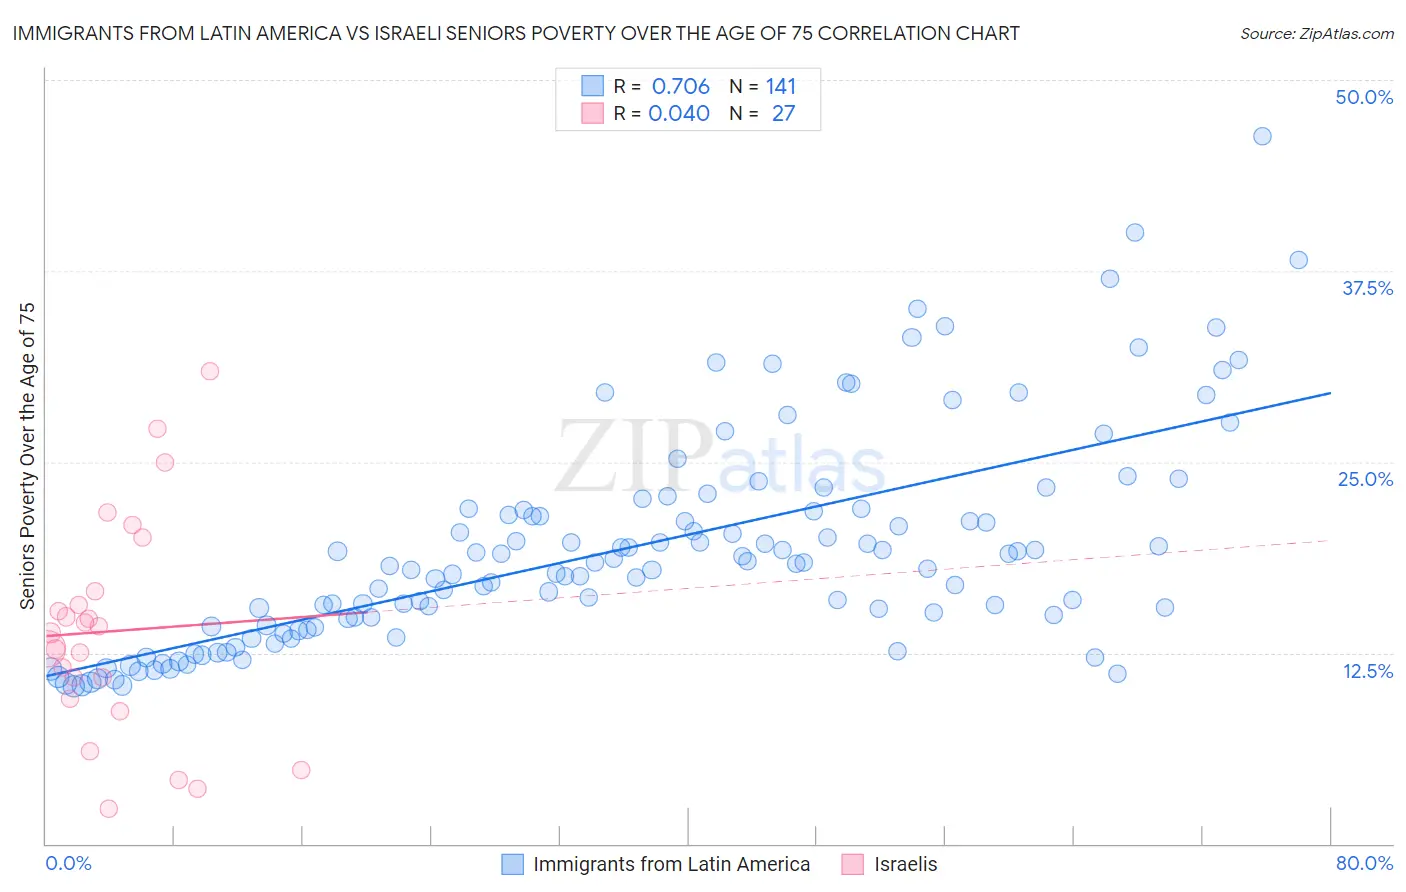
Immigrants from Latin America vs Israeli Seniors Poverty Over the Age of 75 Correlation Chart
The statistical analysis conducted on geographies consisting of 544,282,449 people shows a strong positive correlation between the proportion of Immigrants from Latin America and poverty level among seniors over the age of 75 in the United States with a correlation coefficient (R) of 0.706 and weighted average of 15.6%. Similarly, the statistical analysis conducted on geographies consisting of 209,472,862 people shows no correlation between the proportion of Israelis and poverty level among seniors over the age of 75 in the United States with a correlation coefficient (R) of 0.040 and weighted average of 13.2%, a difference of 18.9%.
Seniors Poverty Over the Age of 75 Correlation Summary
| Measurement | Immigrants from Latin America | Israeli |
| Minimum | 10.3% | 2.3% |
| Maximum | 46.3% | 30.9% |
| Range | 36.0% | 28.6% |
| Mean | 19.3% | 13.9% |
| Median | 18.2% | 13.8% |
| Interquartile 25% (IQ1) | 14.2% | 9.5% |
| Interquartile 75% (IQ3) | 21.8% | 16.5% |
| Interquartile Range (IQR) | 7.6% | 7.0% |
| Standard Deviation (Sample) | 7.0% | 7.1% |
| Standard Deviation (Population) | 7.0% | 6.9% |
Similar Demographics by Seniors Poverty Over the Age of 75
Demographics Similar to Immigrants from Latin America by Seniors Poverty Over the Age of 75
In terms of seniors poverty over the age of 75, the demographic groups most similar to Immigrants from Latin America are West Indian (15.7%, a difference of 0.31%), Immigrants from Honduras (15.7%, a difference of 0.48%), Immigrants from Trinidad and Tobago (15.7%, a difference of 0.66%), Ecuadorian (15.7%, a difference of 0.70%), and Bahamian (15.5%, a difference of 0.78%).
| Demographics | Rating | Rank | Seniors Poverty Over the Age of 75 |
| Immigrants | Jamaica | 0.0 /100 | #294 | Tragic 15.3% |
| U.S. Virgin Islanders | 0.0 /100 | #295 | Tragic 15.4% |
| Yuman | 0.0 /100 | #296 | Tragic 15.4% |
| Hondurans | 0.0 /100 | #297 | Tragic 15.4% |
| Natives/Alaskans | 0.0 /100 | #298 | Tragic 15.5% |
| Spanish American Indians | 0.0 /100 | #299 | Tragic 15.5% |
| Bahamians | 0.0 /100 | #300 | Tragic 15.5% |
| Immigrants | Latin America | 0.0 /100 | #301 | Tragic 15.6% |
| West Indians | 0.0 /100 | #302 | Tragic 15.7% |
| Immigrants | Honduras | 0.0 /100 | #303 | Tragic 15.7% |
| Immigrants | Trinidad and Tobago | 0.0 /100 | #304 | Tragic 15.7% |
| Ecuadorians | 0.0 /100 | #305 | Tragic 15.7% |
| Hispanics or Latinos | 0.0 /100 | #306 | Tragic 15.8% |
| Immigrants | West Indies | 0.0 /100 | #307 | Tragic 15.8% |
| Immigrants | Bangladesh | 0.0 /100 | #308 | Tragic 15.8% |
Demographics Similar to Israelis by Seniors Poverty Over the Age of 75
In terms of seniors poverty over the age of 75, the demographic groups most similar to Israelis are Cree (13.1%, a difference of 0.28%), Somali (13.2%, a difference of 0.44%), Immigrants from China (13.2%, a difference of 0.52%), Subsaharan African (13.2%, a difference of 0.53%), and Shoshone (13.1%, a difference of 0.55%).
| Demographics | Rating | Rank | Seniors Poverty Over the Age of 75 |
| Immigrants | Kazakhstan | 4.3 /100 | #221 | Tragic 13.0% |
| Nigerians | 3.4 /100 | #222 | Tragic 13.0% |
| Immigrants | Nigeria | 3.3 /100 | #223 | Tragic 13.0% |
| Chippewa | 2.9 /100 | #224 | Tragic 13.1% |
| Immigrants | Morocco | 2.8 /100 | #225 | Tragic 13.1% |
| Shoshone | 2.6 /100 | #226 | Tragic 13.1% |
| Cree | 2.3 /100 | #227 | Tragic 13.1% |
| Israelis | 2.0 /100 | #228 | Tragic 13.2% |
| Somalis | 1.6 /100 | #229 | Tragic 13.2% |
| Immigrants | China | 1.5 /100 | #230 | Tragic 13.2% |
| Sub-Saharan Africans | 1.5 /100 | #231 | Tragic 13.2% |
| Immigrants | Chile | 1.3 /100 | #232 | Tragic 13.3% |
| Immigrants | Costa Rica | 1.3 /100 | #233 | Tragic 13.3% |
| Immigrants | Israel | 1.1 /100 | #234 | Tragic 13.3% |
| Japanese | 0.9 /100 | #235 | Tragic 13.3% |