Immigrants from Laos vs Canadian Child Poverty Among Boys Under 16
COMPARE
Immigrants from Laos
Canadian
Child Poverty Among Boys Under 16
Child Poverty Among Boys Under 16 Comparison
Immigrants from Laos
Canadians
18.7%
CHILD POVERTY AMONG BOYS UNDER 16
0.8/ 100
METRIC RATING
238th/ 347
METRIC RANK
15.4%
CHILD POVERTY AMONG BOYS UNDER 16
90.6/ 100
METRIC RATING
128th/ 347
METRIC RANK
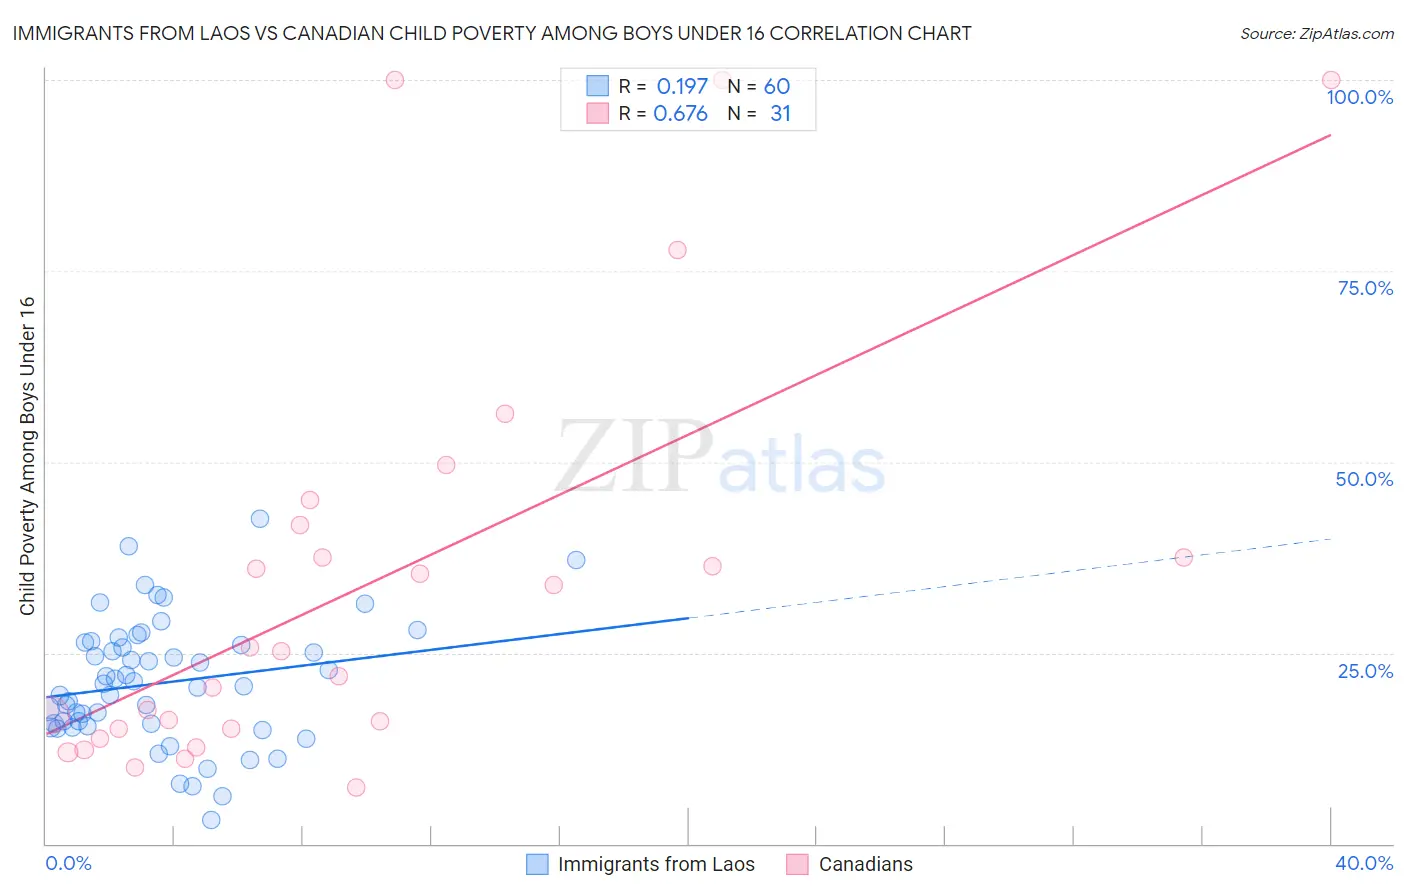
Immigrants from Laos vs Canadian Child Poverty Among Boys Under 16 Correlation Chart
The statistical analysis conducted on geographies consisting of 200,142,611 people shows a poor positive correlation between the proportion of Immigrants from Laos and poverty level among boys under the age of 16 in the United States with a correlation coefficient (R) of 0.197 and weighted average of 18.7%. Similarly, the statistical analysis conducted on geographies consisting of 427,690,103 people shows a significant positive correlation between the proportion of Canadians and poverty level among boys under the age of 16 in the United States with a correlation coefficient (R) of 0.676 and weighted average of 15.4%, a difference of 21.3%.
Child Poverty Among Boys Under 16 Correlation Summary
| Measurement | Immigrants from Laos | Canadian |
| Minimum | 3.1% | 7.3% |
| Maximum | 42.6% | 100.0% |
| Range | 39.5% | 92.7% |
| Mean | 21.1% | 34.1% |
| Median | 20.8% | 25.1% |
| Interquartile 25% (IQ1) | 15.5% | 15.0% |
| Interquartile 75% (IQ3) | 26.2% | 41.7% |
| Interquartile Range (IQR) | 10.7% | 26.7% |
| Standard Deviation (Sample) | 8.1% | 27.1% |
| Standard Deviation (Population) | 8.1% | 26.6% |
Similar Demographics by Child Poverty Among Boys Under 16
Demographics Similar to Immigrants from Laos by Child Poverty Among Boys Under 16
In terms of child poverty among boys under 16, the demographic groups most similar to Immigrants from Laos are Immigrants from Eritrea (18.6%, a difference of 0.22%), Cape Verdean (18.7%, a difference of 0.24%), Sudanese (18.6%, a difference of 0.37%), American (18.6%, a difference of 0.46%), and Immigrants from Cuba (18.8%, a difference of 0.57%).
| Demographics | Rating | Rank | Child Poverty Among Boys Under 16 |
| Nicaraguans | 1.4 /100 | #231 | Tragic 18.4% |
| Marshallese | 1.3 /100 | #232 | Tragic 18.4% |
| Immigrants | Nigeria | 1.2 /100 | #233 | Tragic 18.4% |
| Nigerians | 1.1 /100 | #234 | Tragic 18.5% |
| Americans | 0.9 /100 | #235 | Tragic 18.6% |
| Sudanese | 0.9 /100 | #236 | Tragic 18.6% |
| Immigrants | Eritrea | 0.8 /100 | #237 | Tragic 18.6% |
| Immigrants | Laos | 0.8 /100 | #238 | Tragic 18.7% |
| Cape Verdeans | 0.7 /100 | #239 | Tragic 18.7% |
| Immigrants | Cuba | 0.6 /100 | #240 | Tragic 18.8% |
| Immigrants | Sudan | 0.6 /100 | #241 | Tragic 18.8% |
| Ghanaians | 0.5 /100 | #242 | Tragic 18.9% |
| Immigrants | Azores | 0.4 /100 | #243 | Tragic 18.9% |
| Immigrants | Middle Africa | 0.4 /100 | #244 | Tragic 18.9% |
| Cree | 0.4 /100 | #245 | Tragic 19.0% |
Demographics Similar to Canadians by Child Poverty Among Boys Under 16
In terms of child poverty among boys under 16, the demographic groups most similar to Canadians are Immigrants from Brazil (15.4%, a difference of 0.12%), Mongolian (15.4%, a difference of 0.14%), Carpatho Rusyn (15.4%, a difference of 0.19%), Immigrants from Western Europe (15.4%, a difference of 0.20%), and Palestinian (15.4%, a difference of 0.24%).
| Demographics | Rating | Rank | Child Poverty Among Boys Under 16 |
| Scottish | 93.0 /100 | #121 | Exceptional 15.2% |
| Immigrants | Malaysia | 92.8 /100 | #122 | Exceptional 15.3% |
| Immigrants | Norway | 92.3 /100 | #123 | Exceptional 15.3% |
| Tlingit-Haida | 92.2 /100 | #124 | Exceptional 15.3% |
| Czechoslovakians | 92.1 /100 | #125 | Exceptional 15.3% |
| Palestinians | 91.3 /100 | #126 | Exceptional 15.4% |
| Carpatho Rusyns | 91.1 /100 | #127 | Exceptional 15.4% |
| Canadians | 90.6 /100 | #128 | Exceptional 15.4% |
| Immigrants | Brazil | 90.3 /100 | #129 | Exceptional 15.4% |
| Mongolians | 90.2 /100 | #130 | Exceptional 15.4% |
| Immigrants | Western Europe | 90.0 /100 | #131 | Exceptional 15.4% |
| Immigrants | Kazakhstan | 88.7 /100 | #132 | Excellent 15.5% |
| Welsh | 88.3 /100 | #133 | Excellent 15.5% |
| Peruvians | 88.1 /100 | #134 | Excellent 15.5% |
| Portuguese | 87.5 /100 | #135 | Excellent 15.5% |