Immigrants from Laos vs Canadian Unemployment Among Seniors over 65 years
COMPARE
Immigrants from Laos
Canadian
Unemployment Among Seniors over 65 years
Unemployment Among Seniors over 65 years Comparison
Immigrants from Laos
Canadians
5.1%
UNEMPLOYMENT AMONG SENIORS OVER 65 YEARS
63.8/ 100
METRIC RATING
166th/ 347
METRIC RANK
5.1%
UNEMPLOYMENT AMONG SENIORS OVER 65 YEARS
74.7/ 100
METRIC RATING
152nd/ 347
METRIC RANK
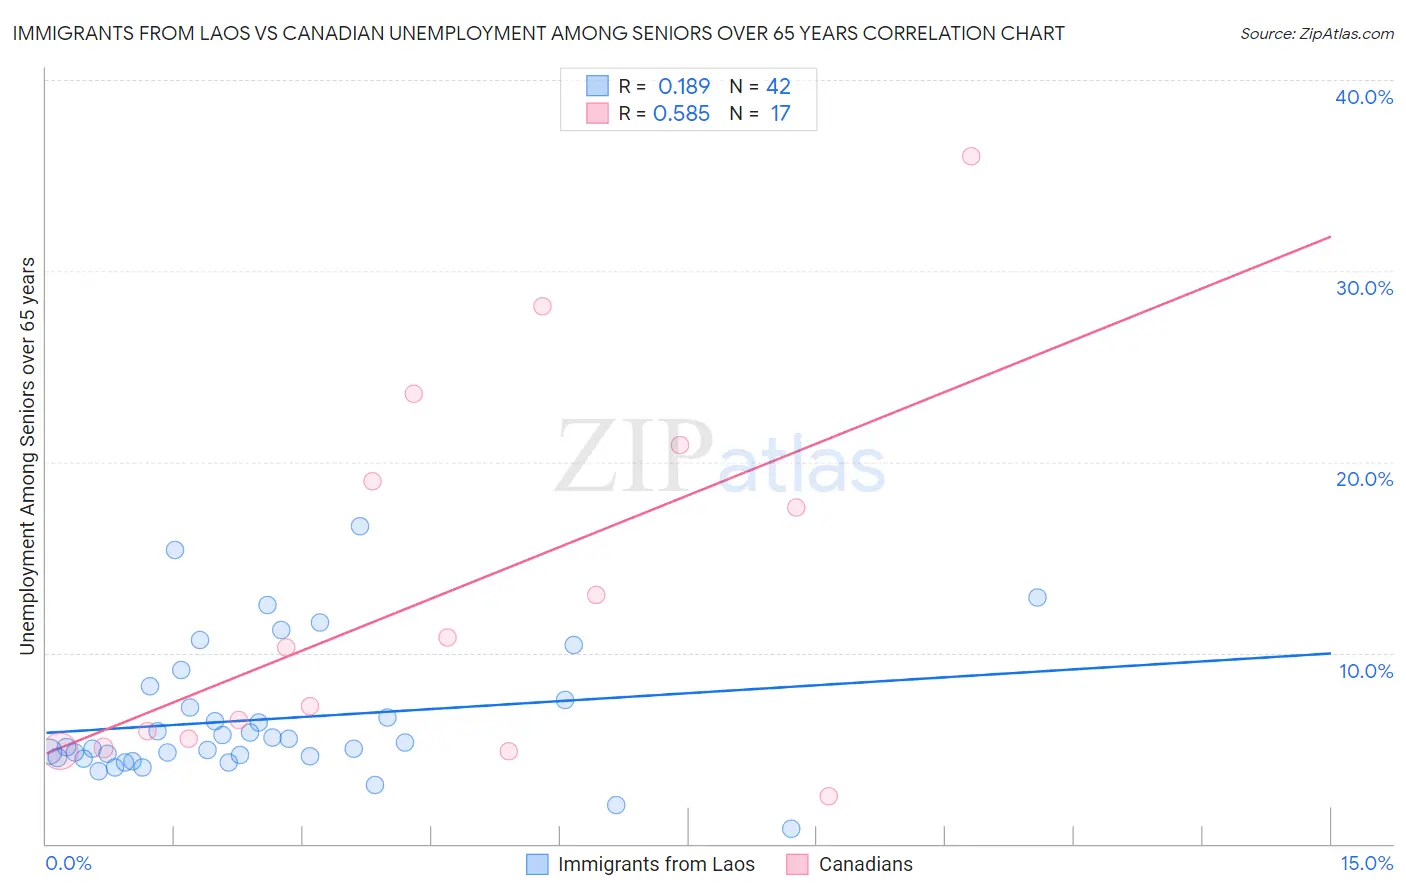
Immigrants from Laos vs Canadian Unemployment Among Seniors over 65 years Correlation Chart
The statistical analysis conducted on geographies consisting of 188,048,022 people shows a poor positive correlation between the proportion of Immigrants from Laos and unemployment rate amomg seniors over the age of 65 in the United States with a correlation coefficient (R) of 0.189 and weighted average of 5.1%. Similarly, the statistical analysis conducted on geographies consisting of 385,292,194 people shows a substantial positive correlation between the proportion of Canadians and unemployment rate amomg seniors over the age of 65 in the United States with a correlation coefficient (R) of 0.585 and weighted average of 5.1%, a difference of 0.42%.
Unemployment Among Seniors over 65 years Correlation Summary
| Measurement | Immigrants from Laos | Canadian |
| Minimum | 0.80% | 2.5% |
| Maximum | 16.6% | 36.0% |
| Range | 15.8% | 33.5% |
| Mean | 6.5% | 13.0% |
| Median | 5.2% | 10.3% |
| Interquartile 25% (IQ1) | 4.5% | 5.2% |
| Interquartile 75% (IQ3) | 7.5% | 19.9% |
| Interquartile Range (IQR) | 3.0% | 14.7% |
| Standard Deviation (Sample) | 3.5% | 9.7% |
| Standard Deviation (Population) | 3.4% | 9.4% |
Demographics Similar to Immigrants from Laos and Canadians by Unemployment Among Seniors over 65 years
In terms of unemployment among seniors over 65 years, the demographic groups most similar to Immigrants from Laos are Immigrants from Ukraine (5.1%, a difference of 0.010%), Potawatomi (5.1%, a difference of 0.020%), Nepalese (5.1%, a difference of 0.020%), Immigrants from South Eastern Asia (5.1%, a difference of 0.060%), and Immigrants from Bosnia and Herzegovina (5.1%, a difference of 0.080%). Similarly, the demographic groups most similar to Canadians are Immigrants from Czechoslovakia (5.1%, a difference of 0.010%), Pakistani (5.1%, a difference of 0.030%), Immigrants from Hong Kong (5.1%, a difference of 0.030%), Immigrants from Asia (5.1%, a difference of 0.040%), and Basque (5.1%, a difference of 0.080%).
| Demographics | Rating | Rank | Unemployment Among Seniors over 65 years |
| Immigrants | Afghanistan | 76.8 /100 | #149 | Good 5.1% |
| Immigrants | Asia | 75.6 /100 | #150 | Good 5.1% |
| Pakistanis | 75.5 /100 | #151 | Good 5.1% |
| Canadians | 74.7 /100 | #152 | Good 5.1% |
| Immigrants | Czechoslovakia | 74.5 /100 | #153 | Good 5.1% |
| Immigrants | Hong Kong | 74.0 /100 | #154 | Good 5.1% |
| Basques | 72.9 /100 | #155 | Good 5.1% |
| Immigrants | Romania | 72.4 /100 | #156 | Good 5.1% |
| Immigrants | Northern Europe | 69.8 /100 | #157 | Good 5.1% |
| Immigrants | Belarus | 69.0 /100 | #158 | Good 5.1% |
| Immigrants | France | 68.6 /100 | #159 | Good 5.1% |
| French | 68.1 /100 | #160 | Good 5.1% |
| Immigrants | Bosnia and Herzegovina | 66.1 /100 | #161 | Good 5.1% |
| Immigrants | South Eastern Asia | 65.6 /100 | #162 | Good 5.1% |
| Potawatomi | 64.5 /100 | #163 | Good 5.1% |
| Nepalese | 64.5 /100 | #164 | Good 5.1% |
| Immigrants | Ukraine | 64.2 /100 | #165 | Good 5.1% |
| Immigrants | Laos | 63.8 /100 | #166 | Good 5.1% |
| Immigrants | Western Europe | 60.4 /100 | #167 | Good 5.1% |
| Mongolians | 59.8 /100 | #168 | Average 5.1% |
| Lithuanians | 58.2 /100 | #169 | Average 5.1% |