Immigrants from Kuwait vs Immigrants from Latin America Child Poverty Under the Age of 5
COMPARE
Immigrants from Kuwait
Immigrants from Latin America
Child Poverty Under the Age of 5
Child Poverty Under the Age of 5 Comparison
Immigrants from Kuwait
Immigrants from Latin America
16.0%
CHILD POVERTY UNDER THE AGE OF 5
93.9/ 100
METRIC RATING
114th/ 347
METRIC RANK
21.2%
CHILD POVERTY UNDER THE AGE OF 5
0.0/ 100
METRIC RATING
286th/ 347
METRIC RANK
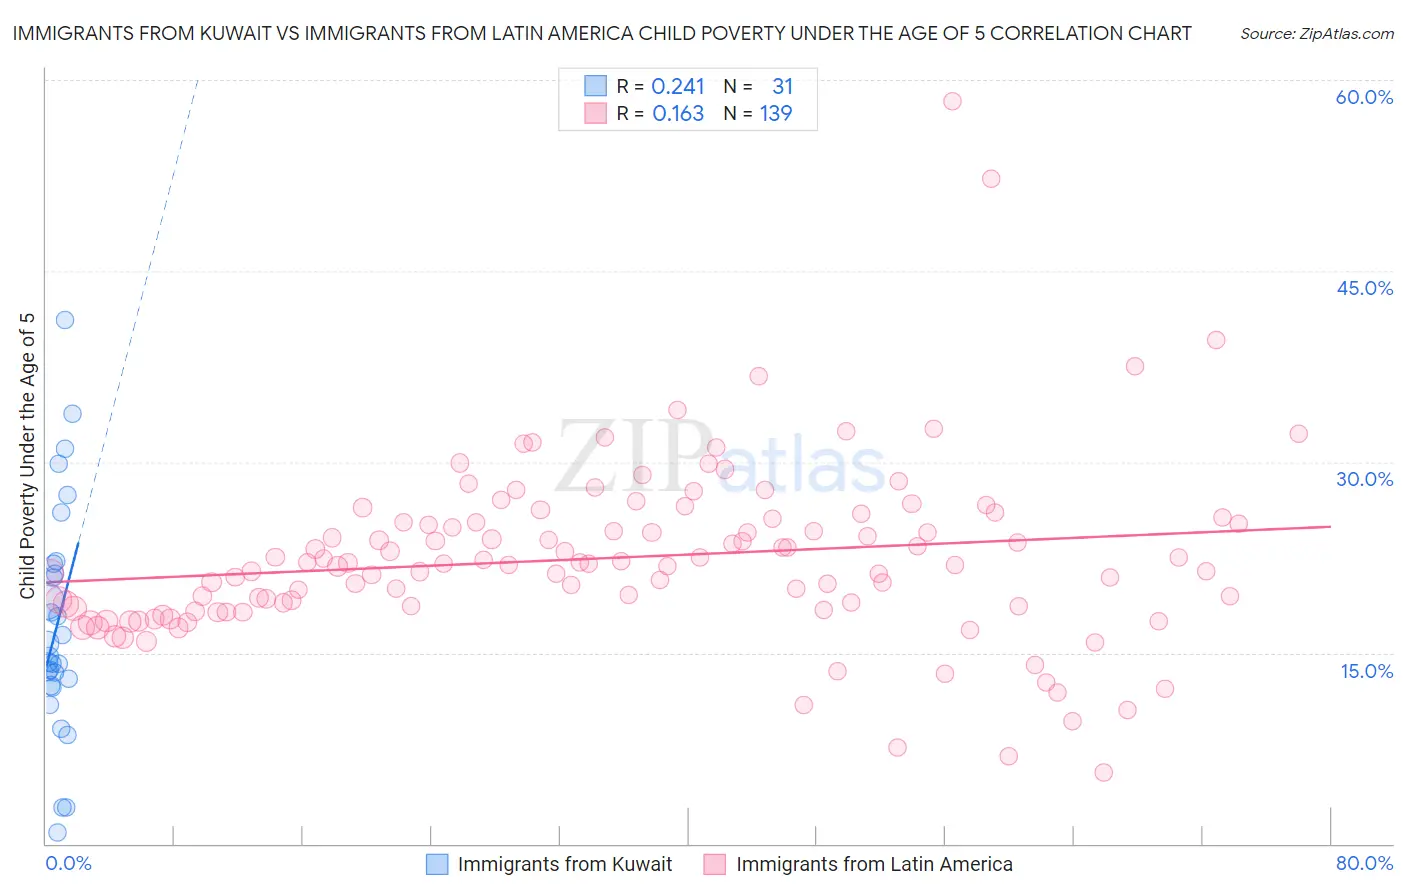
Immigrants from Kuwait vs Immigrants from Latin America Child Poverty Under the Age of 5 Correlation Chart
The statistical analysis conducted on geographies consisting of 134,511,705 people shows a weak positive correlation between the proportion of Immigrants from Kuwait and poverty level among children under the age of 5 in the United States with a correlation coefficient (R) of 0.241 and weighted average of 16.0%. Similarly, the statistical analysis conducted on geographies consisting of 523,296,541 people shows a poor positive correlation between the proportion of Immigrants from Latin America and poverty level among children under the age of 5 in the United States with a correlation coefficient (R) of 0.163 and weighted average of 21.2%, a difference of 32.6%.
Child Poverty Under the Age of 5 Correlation Summary
| Measurement | Immigrants from Kuwait | Immigrants from Latin America |
| Minimum | 0.87% | 5.6% |
| Maximum | 41.2% | 58.4% |
| Range | 40.3% | 52.7% |
| Mean | 17.2% | 22.5% |
| Median | 14.7% | 22.0% |
| Interquartile 25% (IQ1) | 12.4% | 18.5% |
| Interquartile 75% (IQ3) | 22.0% | 25.3% |
| Interquartile Range (IQR) | 9.5% | 6.8% |
| Standard Deviation (Sample) | 9.1% | 7.0% |
| Standard Deviation (Population) | 8.9% | 7.0% |
Similar Demographics by Child Poverty Under the Age of 5
Demographics Similar to Immigrants from Kuwait by Child Poverty Under the Age of 5
In terms of child poverty under the age of 5, the demographic groups most similar to Immigrants from Kuwait are Albanian (16.0%, a difference of 0.020%), Peruvian (16.0%, a difference of 0.090%), Puget Sound Salish (16.0%, a difference of 0.090%), Pakistani (16.0%, a difference of 0.15%), and Romanian (16.0%, a difference of 0.18%).
| Demographics | Rating | Rank | Child Poverty Under the Age of 5 |
| Slovenes | 94.4 /100 | #107 | Exceptional 16.0% |
| Immigrants | Brazil | 94.4 /100 | #108 | Exceptional 16.0% |
| Northern Europeans | 94.3 /100 | #109 | Exceptional 16.0% |
| Romanians | 94.3 /100 | #110 | Exceptional 16.0% |
| Pakistanis | 94.2 /100 | #111 | Exceptional 16.0% |
| Peruvians | 94.1 /100 | #112 | Exceptional 16.0% |
| Puget Sound Salish | 94.1 /100 | #113 | Exceptional 16.0% |
| Immigrants | Kuwait | 93.9 /100 | #114 | Exceptional 16.0% |
| Albanians | 93.8 /100 | #115 | Exceptional 16.0% |
| Immigrants | Austria | 93.5 /100 | #116 | Exceptional 16.0% |
| Basques | 93.4 /100 | #117 | Exceptional 16.0% |
| Immigrants | Denmark | 93.4 /100 | #118 | Exceptional 16.0% |
| Immigrants | Jordan | 93.2 /100 | #119 | Exceptional 16.1% |
| Immigrants | Peru | 92.6 /100 | #120 | Exceptional 16.1% |
| Mongolians | 92.5 /100 | #121 | Exceptional 16.1% |
Demographics Similar to Immigrants from Latin America by Child Poverty Under the Age of 5
In terms of child poverty under the age of 5, the demographic groups most similar to Immigrants from Latin America are Haitian (21.2%, a difference of 0.080%), Immigrants from Zaire (21.3%, a difference of 0.090%), Immigrants from Senegal (21.3%, a difference of 0.27%), Immigrants from Haiti (21.3%, a difference of 0.34%), and Somali (21.1%, a difference of 0.55%).
| Demographics | Rating | Rank | Child Poverty Under the Age of 5 |
| Sub-Saharan Africans | 0.0 /100 | #279 | Tragic 20.8% |
| French American Indians | 0.0 /100 | #280 | Tragic 20.8% |
| Senegalese | 0.0 /100 | #281 | Tragic 20.9% |
| Potawatomi | 0.0 /100 | #282 | Tragic 21.0% |
| Comanche | 0.0 /100 | #283 | Tragic 21.0% |
| Somalis | 0.0 /100 | #284 | Tragic 21.1% |
| Haitians | 0.0 /100 | #285 | Tragic 21.2% |
| Immigrants | Latin America | 0.0 /100 | #286 | Tragic 21.2% |
| Immigrants | Zaire | 0.0 /100 | #287 | Tragic 21.3% |
| Immigrants | Senegal | 0.0 /100 | #288 | Tragic 21.3% |
| Immigrants | Haiti | 0.0 /100 | #289 | Tragic 21.3% |
| Immigrants | Caribbean | 0.0 /100 | #290 | Tragic 21.4% |
| British West Indians | 0.0 /100 | #291 | Tragic 21.4% |
| Immigrants | Somalia | 0.0 /100 | #292 | Tragic 21.6% |
| Mexicans | 0.0 /100 | #293 | Tragic 21.6% |