Immigrants from Korea vs Immigrants from Turkey Median Family Income
COMPARE
Immigrants from Korea
Immigrants from Turkey
Median Family Income
Median Family Income Comparison
Immigrants from Korea
Immigrants from Turkey
$122,800
MEDIAN FAMILY INCOME
100.0/ 100
METRIC RATING
21st/ 347
METRIC RANK
$118,325
MEDIAN FAMILY INCOME
100.0/ 100
METRIC RATING
38th/ 347
METRIC RANK
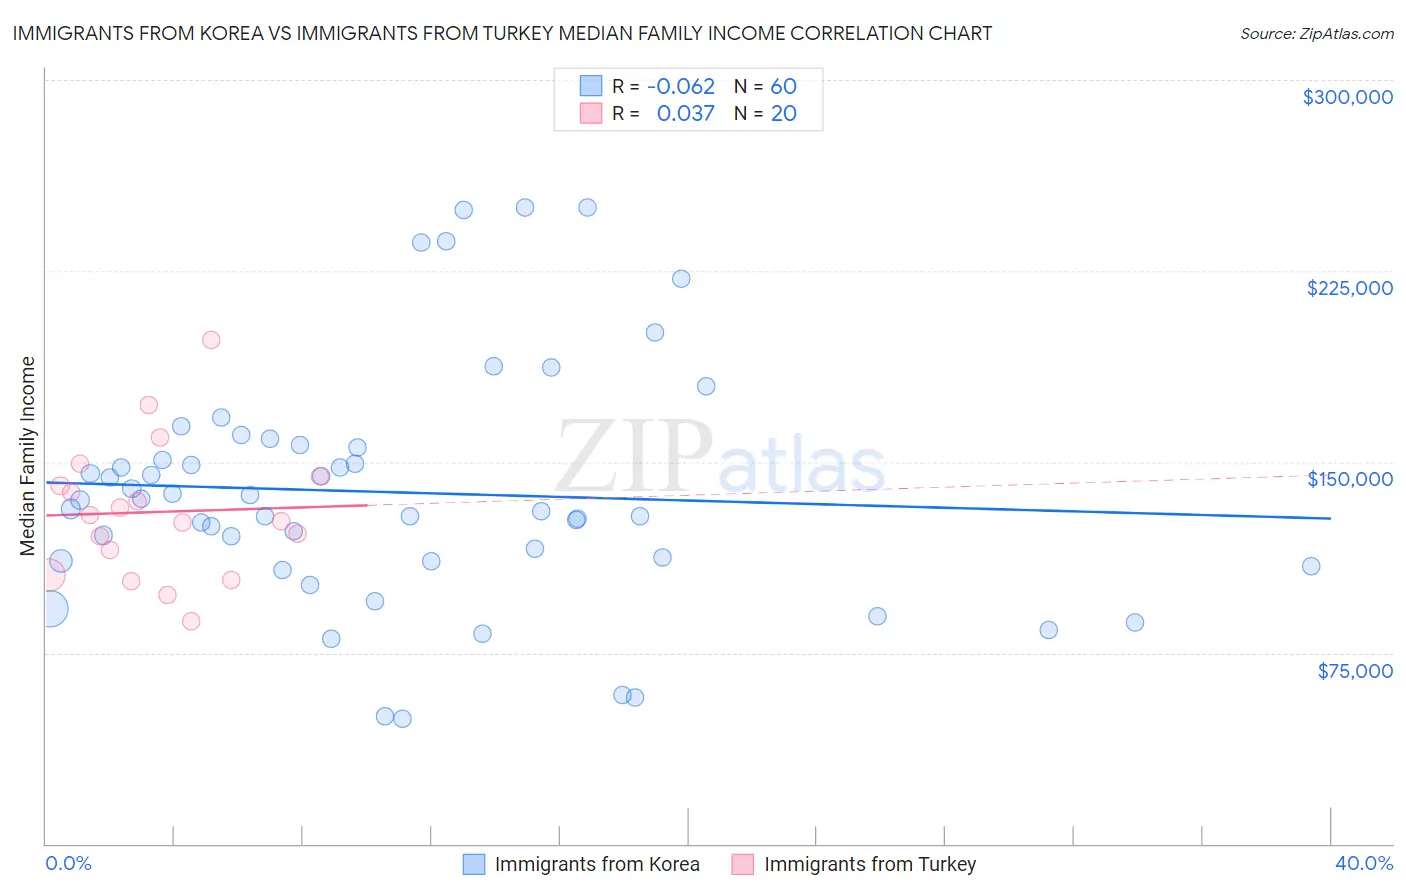
Immigrants from Korea vs Immigrants from Turkey Median Family Income Correlation Chart
The statistical analysis conducted on geographies consisting of 415,814,318 people shows a slight negative correlation between the proportion of Immigrants from Korea and median family income in the United States with a correlation coefficient (R) of -0.062 and weighted average of $122,800. Similarly, the statistical analysis conducted on geographies consisting of 222,914,261 people shows no correlation between the proportion of Immigrants from Turkey and median family income in the United States with a correlation coefficient (R) of 0.037 and weighted average of $118,325, a difference of 3.8%.
Median Family Income Correlation Summary
| Measurement | Immigrants from Korea | Immigrants from Turkey |
| Minimum | $49,182 | $87,281 |
| Maximum | $250,001 | $197,922 |
| Range | $200,819 | $110,641 |
| Mean | $138,061 | $130,330 |
| Median | $133,220 | $128,029 |
| Interquartile 25% (IQ1) | $110,996 | $110,406 |
| Interquartile 75% (IQ3) | $156,101 | $142,421 |
| Interquartile Range (IQR) | $45,105 | $32,015 |
| Standard Deviation (Sample) | $47,393 | $26,517 |
| Standard Deviation (Population) | $46,996 | $25,846 |
Demographics Similar to Immigrants from Korea and Immigrants from Turkey by Median Family Income
In terms of median family income, the demographic groups most similar to Immigrants from Korea are Immigrants from Sweden ($122,765, a difference of 0.030%), Immigrants from Japan ($122,764, a difference of 0.030%), Burmese ($123,369, a difference of 0.46%), Immigrants from Northern Europe ($121,840, a difference of 0.79%), and Immigrants from Belgium ($123,831, a difference of 0.84%). Similarly, the demographic groups most similar to Immigrants from Turkey are Immigrants from Asia ($118,291, a difference of 0.030%), Australian ($118,440, a difference of 0.10%), Israeli ($118,577, a difference of 0.21%), Soviet Union ($119,262, a difference of 0.79%), and Bolivian ($119,479, a difference of 0.97%).
| Demographics | Rating | Rank | Median Family Income |
| Immigrants | Belgium | 100.0 /100 | #19 | Exceptional $123,831 |
| Burmese | 100.0 /100 | #20 | Exceptional $123,369 |
| Immigrants | Korea | 100.0 /100 | #21 | Exceptional $122,800 |
| Immigrants | Sweden | 100.0 /100 | #22 | Exceptional $122,765 |
| Immigrants | Japan | 100.0 /100 | #23 | Exceptional $122,764 |
| Immigrants | Northern Europe | 100.0 /100 | #24 | Exceptional $121,840 |
| Turks | 100.0 /100 | #25 | Exceptional $121,202 |
| Immigrants | Switzerland | 100.0 /100 | #26 | Exceptional $120,726 |
| Russians | 100.0 /100 | #27 | Exceptional $120,487 |
| Immigrants | Denmark | 100.0 /100 | #28 | Exceptional $120,445 |
| Latvians | 100.0 /100 | #29 | Exceptional $120,301 |
| Immigrants | Sri Lanka | 100.0 /100 | #30 | Exceptional $120,263 |
| Immigrants | France | 100.0 /100 | #31 | Exceptional $120,076 |
| Asians | 100.0 /100 | #32 | Exceptional $119,955 |
| Bhutanese | 100.0 /100 | #33 | Exceptional $119,800 |
| Bolivians | 100.0 /100 | #34 | Exceptional $119,479 |
| Soviet Union | 100.0 /100 | #35 | Exceptional $119,262 |
| Israelis | 100.0 /100 | #36 | Exceptional $118,577 |
| Australians | 100.0 /100 | #37 | Exceptional $118,440 |
| Immigrants | Turkey | 100.0 /100 | #38 | Exceptional $118,325 |
| Immigrants | Asia | 100.0 /100 | #39 | Exceptional $118,291 |