Immigrants from Korea vs Immigrants from Senegal Seniors Poverty Over the Age of 65
COMPARE
Immigrants from Korea
Immigrants from Senegal
Seniors Poverty Over the Age of 65
Seniors Poverty Over the Age of 65 Comparison
Immigrants from Korea
Immigrants from Senegal
10.3%
SENIORS POVERTY OVER THE AGE OF 65
93.3/ 100
METRIC RATING
112th/ 347
METRIC RANK
13.6%
SENIORS POVERTY OVER THE AGE OF 65
0.0/ 100
METRIC RATING
286th/ 347
METRIC RANK
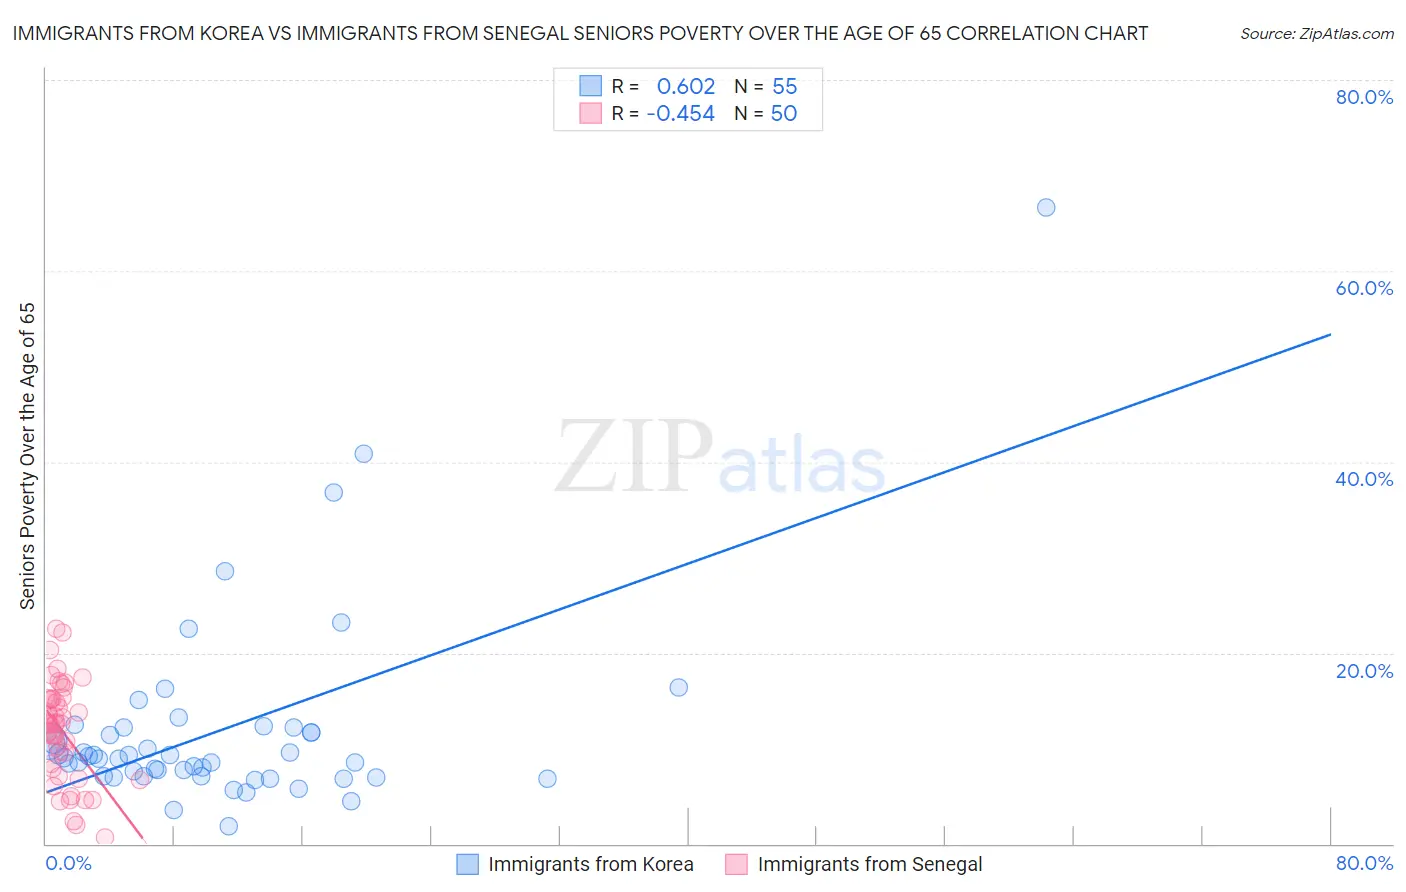
Immigrants from Korea vs Immigrants from Senegal Seniors Poverty Over the Age of 65 Correlation Chart
The statistical analysis conducted on geographies consisting of 414,371,248 people shows a significant positive correlation between the proportion of Immigrants from Korea and poverty level among seniors over the age of 65 in the United States with a correlation coefficient (R) of 0.602 and weighted average of 10.3%. Similarly, the statistical analysis conducted on geographies consisting of 90,070,105 people shows a moderate negative correlation between the proportion of Immigrants from Senegal and poverty level among seniors over the age of 65 in the United States with a correlation coefficient (R) of -0.454 and weighted average of 13.6%, a difference of 31.8%.
Seniors Poverty Over the Age of 65 Correlation Summary
| Measurement | Immigrants from Korea | Immigrants from Senegal |
| Minimum | 1.8% | 0.71% |
| Maximum | 66.7% | 22.5% |
| Range | 64.8% | 21.8% |
| Mean | 11.9% | 11.8% |
| Median | 9.0% | 12.6% |
| Interquartile 25% (IQ1) | 7.1% | 7.9% |
| Interquartile 75% (IQ3) | 12.1% | 15.2% |
| Interquartile Range (IQR) | 5.1% | 7.3% |
| Standard Deviation (Sample) | 10.4% | 5.2% |
| Standard Deviation (Population) | 10.3% | 5.1% |
Similar Demographics by Seniors Poverty Over the Age of 65
Demographics Similar to Immigrants from Korea by Seniors Poverty Over the Age of 65
In terms of seniors poverty over the age of 65, the demographic groups most similar to Immigrants from Korea are Immigrants from Belgium (10.3%, a difference of 0.020%), Immigrants from Romania (10.3%, a difference of 0.040%), Immigrants from Zimbabwe (10.3%, a difference of 0.060%), Syrian (10.3%, a difference of 0.20%), and Immigrants from Croatia (10.3%, a difference of 0.22%).
| Demographics | Rating | Rank | Seniors Poverty Over the Age of 65 |
| Aleuts | 94.1 /100 | #105 | Exceptional 10.3% |
| Kenyans | 94.1 /100 | #106 | Exceptional 10.3% |
| Hawaiians | 93.9 /100 | #107 | Exceptional 10.3% |
| Immigrants | Croatia | 93.9 /100 | #108 | Exceptional 10.3% |
| Syrians | 93.8 /100 | #109 | Exceptional 10.3% |
| Immigrants | Zimbabwe | 93.5 /100 | #110 | Exceptional 10.3% |
| Immigrants | Belgium | 93.4 /100 | #111 | Exceptional 10.3% |
| Immigrants | Korea | 93.3 /100 | #112 | Exceptional 10.3% |
| Immigrants | Romania | 93.3 /100 | #113 | Exceptional 10.3% |
| Immigrants | Denmark | 92.7 /100 | #114 | Exceptional 10.3% |
| Immigrants | Italy | 92.6 /100 | #115 | Exceptional 10.3% |
| Pakistanis | 92.2 /100 | #116 | Exceptional 10.3% |
| Lebanese | 92.0 /100 | #117 | Exceptional 10.3% |
| Okinawans | 91.7 /100 | #118 | Exceptional 10.4% |
| Immigrants | Western Europe | 91.1 /100 | #119 | Exceptional 10.4% |
Demographics Similar to Immigrants from Senegal by Seniors Poverty Over the Age of 65
In terms of seniors poverty over the age of 65, the demographic groups most similar to Immigrants from Senegal are Immigrants from Mexico (13.6%, a difference of 0.12%), Belizean (13.6%, a difference of 0.26%), Guatemalan (13.5%, a difference of 0.27%), Colville (13.5%, a difference of 0.50%), and Jamaican (13.6%, a difference of 0.53%).
| Demographics | Rating | Rank | Seniors Poverty Over the Age of 65 |
| Mexicans | 0.0 /100 | #279 | Tragic 13.1% |
| Yuman | 0.0 /100 | #280 | Tragic 13.1% |
| Immigrants | El Salvador | 0.0 /100 | #281 | Tragic 13.1% |
| Senegalese | 0.0 /100 | #282 | Tragic 13.3% |
| Central Americans | 0.0 /100 | #283 | Tragic 13.4% |
| Colville | 0.0 /100 | #284 | Tragic 13.5% |
| Guatemalans | 0.0 /100 | #285 | Tragic 13.5% |
| Immigrants | Senegal | 0.0 /100 | #286 | Tragic 13.6% |
| Immigrants | Mexico | 0.0 /100 | #287 | Tragic 13.6% |
| Belizeans | 0.0 /100 | #288 | Tragic 13.6% |
| Jamaicans | 0.0 /100 | #289 | Tragic 13.6% |
| Immigrants | Central America | 0.0 /100 | #290 | Tragic 13.6% |
| Blacks/African Americans | 0.0 /100 | #291 | Tragic 13.7% |
| Spanish American Indians | 0.0 /100 | #292 | Tragic 13.8% |
| Immigrants | Guatemala | 0.0 /100 | #293 | Tragic 13.8% |