Immigrants from Jordan vs Nonimmigrants Female Poverty Among 18-24 Year Olds
COMPARE
Immigrants from Jordan
Nonimmigrants
Female Poverty Among 18-24 Year Olds
Female Poverty Among 18-24 Year Olds Comparison
Immigrants from Jordan
Nonimmigrants
19.1%
FEMALE POVERTY AMONG 18-24 YEAR OLDS
98.4/ 100
METRIC RATING
98th/ 347
METRIC RANK
21.5%
FEMALE POVERTY AMONG 18-24 YEAR OLDS
0.3/ 100
METRIC RATING
265th/ 347
METRIC RANK
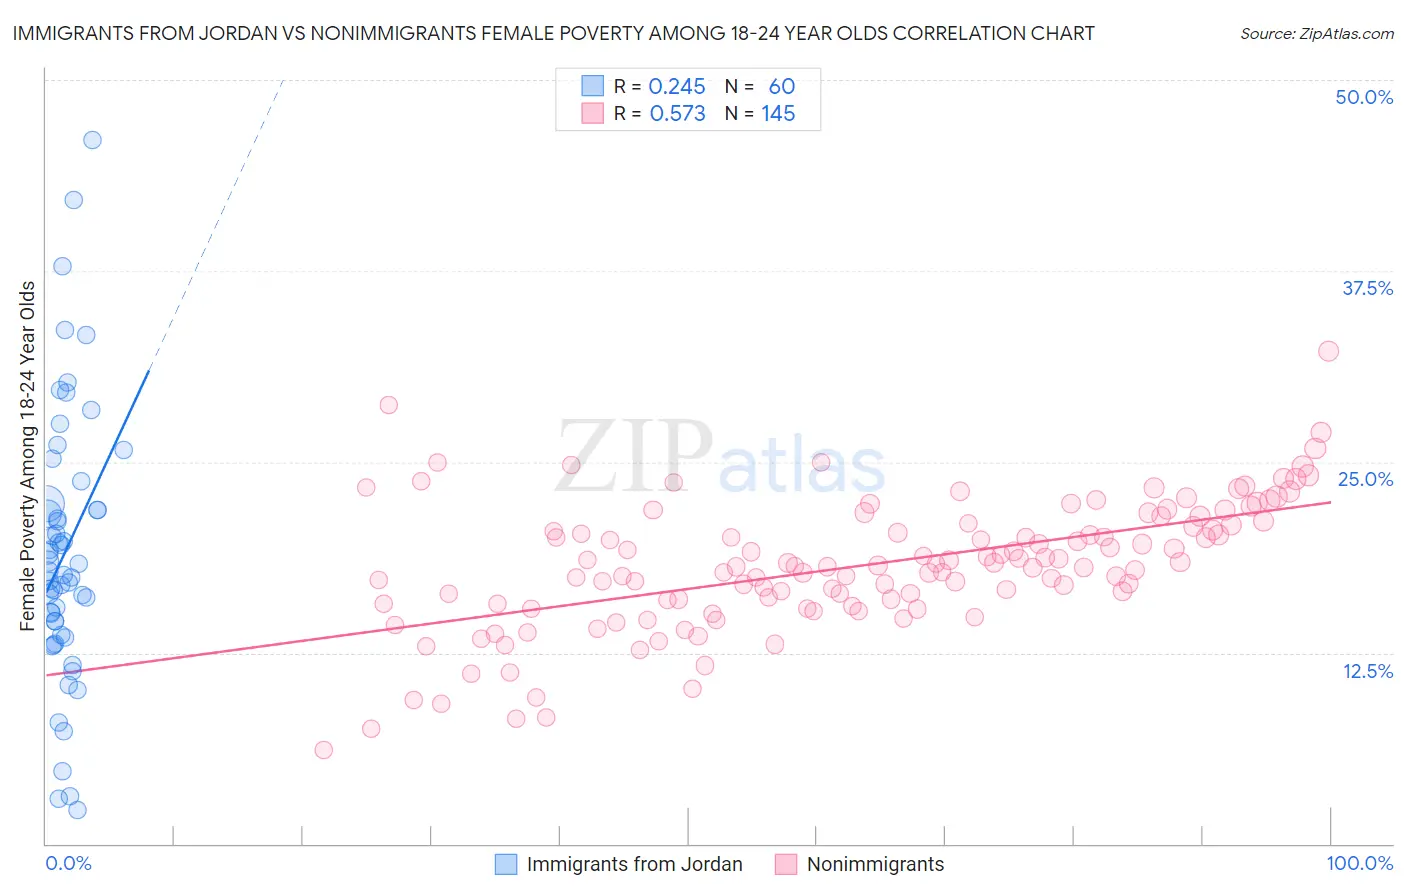
Immigrants from Jordan vs Nonimmigrants Female Poverty Among 18-24 Year Olds Correlation Chart
The statistical analysis conducted on geographies consisting of 179,737,092 people shows a weak positive correlation between the proportion of Immigrants from Jordan and poverty level among females between the ages 18 and 24 in the United States with a correlation coefficient (R) of 0.245 and weighted average of 19.1%. Similarly, the statistical analysis conducted on geographies consisting of 546,044,220 people shows a substantial positive correlation between the proportion of Nonimmigrants and poverty level among females between the ages 18 and 24 in the United States with a correlation coefficient (R) of 0.573 and weighted average of 21.5%, a difference of 12.7%.
Female Poverty Among 18-24 Year Olds Correlation Summary
| Measurement | Immigrants from Jordan | Nonimmigrants |
| Minimum | 2.2% | 6.2% |
| Maximum | 46.0% | 32.3% |
| Range | 43.9% | 26.1% |
| Mean | 19.0% | 18.2% |
| Median | 17.7% | 18.2% |
| Interquartile 25% (IQ1) | 14.1% | 15.7% |
| Interquartile 75% (IQ3) | 22.1% | 20.9% |
| Interquartile Range (IQR) | 7.9% | 5.2% |
| Standard Deviation (Sample) | 8.8% | 4.3% |
| Standard Deviation (Population) | 8.7% | 4.2% |
Similar Demographics by Female Poverty Among 18-24 Year Olds
Demographics Similar to Immigrants from Jordan by Female Poverty Among 18-24 Year Olds
In terms of female poverty among 18-24 year olds, the demographic groups most similar to Immigrants from Jordan are Salvadoran (19.1%, a difference of 0.010%), Immigrants from Czechoslovakia (19.1%, a difference of 0.070%), Chilean (19.1%, a difference of 0.090%), Ecuadorian (19.1%, a difference of 0.18%), and Immigrants from Caribbean (19.1%, a difference of 0.20%).
| Demographics | Rating | Rank | Female Poverty Among 18-24 Year Olds |
| Romanians | 98.9 /100 | #91 | Exceptional 19.0% |
| Filipinos | 98.9 /100 | #92 | Exceptional 19.0% |
| Haitians | 98.9 /100 | #93 | Exceptional 19.0% |
| Ukrainians | 98.8 /100 | #94 | Exceptional 19.0% |
| Guamanians/Chamorros | 98.8 /100 | #95 | Exceptional 19.0% |
| Sierra Leoneans | 98.7 /100 | #96 | Exceptional 19.0% |
| Salvadorans | 98.4 /100 | #97 | Exceptional 19.1% |
| Immigrants | Jordan | 98.4 /100 | #98 | Exceptional 19.1% |
| Immigrants | Czechoslovakia | 98.3 /100 | #99 | Exceptional 19.1% |
| Chileans | 98.3 /100 | #100 | Exceptional 19.1% |
| Ecuadorians | 98.1 /100 | #101 | Exceptional 19.1% |
| Immigrants | Caribbean | 98.1 /100 | #102 | Exceptional 19.1% |
| Serbians | 98.0 /100 | #103 | Exceptional 19.1% |
| Immigrants | Afghanistan | 98.0 /100 | #104 | Exceptional 19.1% |
| Immigrants | Ecuador | 97.8 /100 | #105 | Exceptional 19.2% |
Demographics Similar to Nonimmigrants by Female Poverty Among 18-24 Year Olds
In terms of female poverty among 18-24 year olds, the demographic groups most similar to Nonimmigrants are Honduran (21.5%, a difference of 0.010%), Icelander (21.5%, a difference of 0.060%), Alaska Native (21.5%, a difference of 0.070%), American (21.6%, a difference of 0.15%), and Immigrants from Burma/Myanmar (21.6%, a difference of 0.30%).
| Demographics | Rating | Rank | Female Poverty Among 18-24 Year Olds |
| Vietnamese | 0.6 /100 | #258 | Tragic 21.4% |
| Immigrants | France | 0.6 /100 | #259 | Tragic 21.4% |
| Immigrants | Norway | 0.6 /100 | #260 | Tragic 21.4% |
| Immigrants | Bahamas | 0.5 /100 | #261 | Tragic 21.4% |
| Immigrants | Eastern Africa | 0.4 /100 | #262 | Tragic 21.4% |
| Icelanders | 0.3 /100 | #263 | Tragic 21.5% |
| Hondurans | 0.3 /100 | #264 | Tragic 21.5% |
| Immigrants | Nonimmigrants | 0.3 /100 | #265 | Tragic 21.5% |
| Alaska Natives | 0.3 /100 | #266 | Tragic 21.5% |
| Americans | 0.3 /100 | #267 | Tragic 21.6% |
| Immigrants | Burma/Myanmar | 0.2 /100 | #268 | Tragic 21.6% |
| Celtics | 0.2 /100 | #269 | Tragic 21.6% |
| Mongolians | 0.2 /100 | #270 | Tragic 21.6% |
| Scotch-Irish | 0.2 /100 | #271 | Tragic 21.6% |
| Basques | 0.2 /100 | #272 | Tragic 21.7% |