Immigrants from Jamaica vs Czech Child Poverty Among Boys Under 16
COMPARE
Immigrants from Jamaica
Czech
Child Poverty Among Boys Under 16
Child Poverty Among Boys Under 16 Comparison
Immigrants from Jamaica
Czechs
20.1%
CHILD POVERTY AMONG BOYS UNDER 16
0.0/ 100
METRIC RATING
283rd/ 347
METRIC RANK
14.1%
CHILD POVERTY AMONG BOYS UNDER 16
99.3/ 100
METRIC RATING
49th/ 347
METRIC RANK
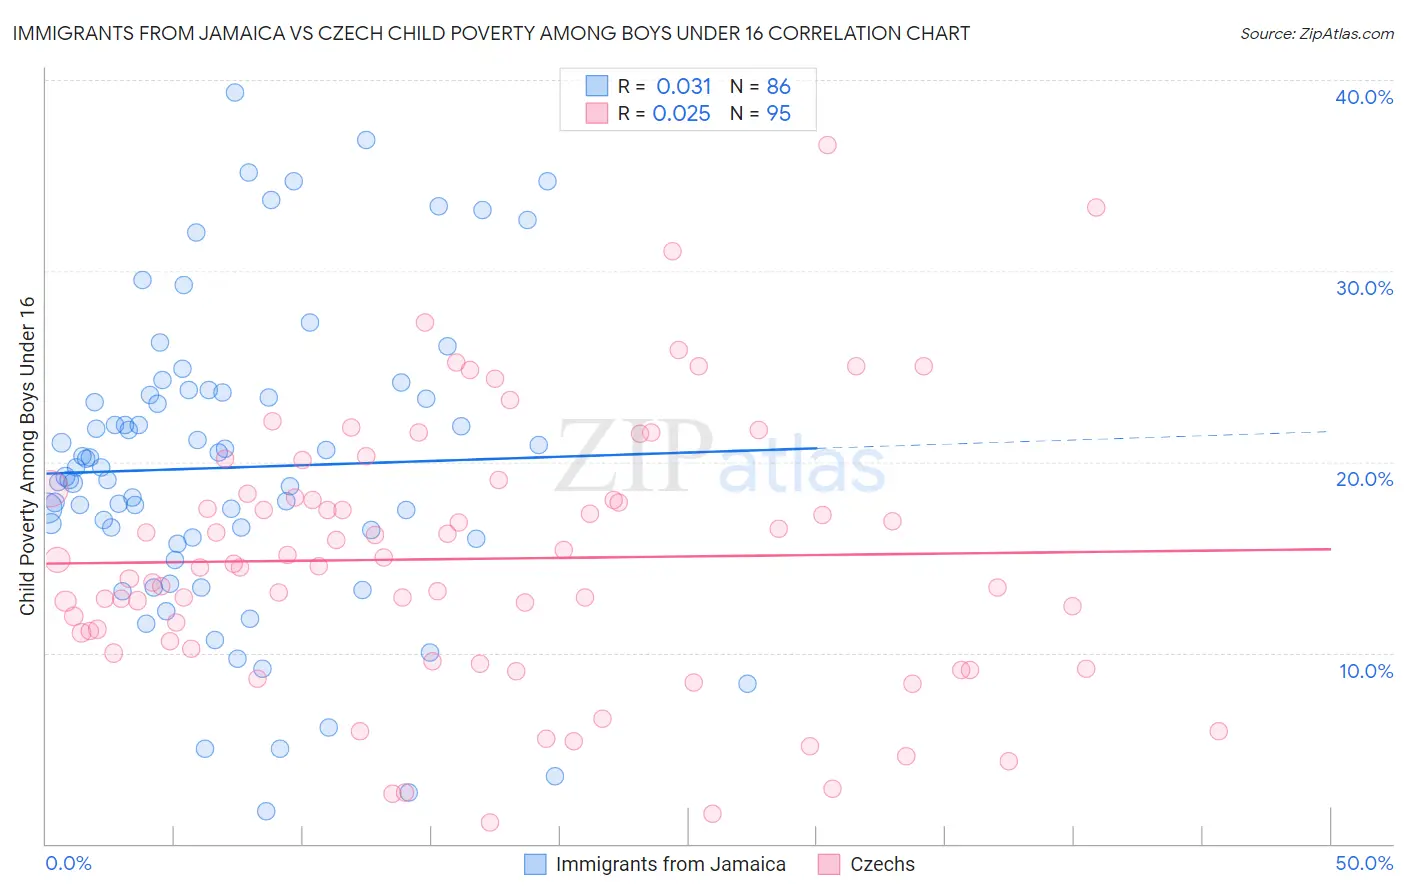
Immigrants from Jamaica vs Czech Child Poverty Among Boys Under 16 Correlation Chart
The statistical analysis conducted on geographies consisting of 298,141,614 people shows no correlation between the proportion of Immigrants from Jamaica and poverty level among boys under the age of 16 in the United States with a correlation coefficient (R) of 0.031 and weighted average of 20.1%. Similarly, the statistical analysis conducted on geographies consisting of 471,396,955 people shows no correlation between the proportion of Czechs and poverty level among boys under the age of 16 in the United States with a correlation coefficient (R) of 0.025 and weighted average of 14.1%, a difference of 42.2%.
Child Poverty Among Boys Under 16 Correlation Summary
| Measurement | Immigrants from Jamaica | Czech |
| Minimum | 1.7% | 1.1% |
| Maximum | 39.3% | 36.6% |
| Range | 37.6% | 35.5% |
| Mean | 19.7% | 14.9% |
| Median | 19.5% | 14.5% |
| Interquartile 25% (IQ1) | 16.0% | 10.2% |
| Interquartile 75% (IQ3) | 23.5% | 18.4% |
| Interquartile Range (IQR) | 7.5% | 8.1% |
| Standard Deviation (Sample) | 7.9% | 7.0% |
| Standard Deviation (Population) | 7.9% | 6.9% |
Similar Demographics by Child Poverty Among Boys Under 16
Demographics Similar to Immigrants from Jamaica by Child Poverty Among Boys Under 16
In terms of child poverty among boys under 16, the demographic groups most similar to Immigrants from Jamaica are Comanche (20.1%, a difference of 0.13%), Immigrants from Zaire (20.1%, a difference of 0.18%), Barbadian (20.2%, a difference of 0.23%), Central American (20.1%, a difference of 0.24%), and Bangladeshi (20.0%, a difference of 0.36%).
| Demographics | Rating | Rank | Child Poverty Among Boys Under 16 |
| Sub-Saharan Africans | 0.0 /100 | #276 | Tragic 20.0% |
| Immigrants | Barbados | 0.0 /100 | #277 | Tragic 20.0% |
| Immigrants | West Indies | 0.0 /100 | #278 | Tragic 20.0% |
| Bangladeshis | 0.0 /100 | #279 | Tragic 20.0% |
| Central Americans | 0.0 /100 | #280 | Tragic 20.1% |
| Immigrants | Zaire | 0.0 /100 | #281 | Tragic 20.1% |
| Comanche | 0.0 /100 | #282 | Tragic 20.1% |
| Immigrants | Jamaica | 0.0 /100 | #283 | Tragic 20.1% |
| Barbadians | 0.0 /100 | #284 | Tragic 20.2% |
| Arapaho | 0.0 /100 | #285 | Tragic 20.2% |
| West Indians | 0.0 /100 | #286 | Tragic 20.3% |
| Immigrants | Belize | 0.0 /100 | #287 | Tragic 20.3% |
| Immigrants | St. Vincent and the Grenadines | 0.0 /100 | #288 | Tragic 20.3% |
| Blackfeet | 0.0 /100 | #289 | Tragic 20.4% |
| Senegalese | 0.0 /100 | #290 | Tragic 20.6% |
Demographics Similar to Czechs by Child Poverty Among Boys Under 16
In terms of child poverty among boys under 16, the demographic groups most similar to Czechs are Immigrants from Indonesia (14.1%, a difference of 0.090%), Immigrants from Moldova (14.1%, a difference of 0.11%), Greek (14.1%, a difference of 0.38%), Immigrants from Scotland (14.1%, a difference of 0.48%), and Italian (14.2%, a difference of 0.49%).
| Demographics | Rating | Rank | Child Poverty Among Boys Under 16 |
| Koreans | 99.6 /100 | #42 | Exceptional 14.0% |
| Croatians | 99.5 /100 | #43 | Exceptional 14.0% |
| Estonians | 99.4 /100 | #44 | Exceptional 14.1% |
| Immigrants | Scotland | 99.4 /100 | #45 | Exceptional 14.1% |
| Greeks | 99.4 /100 | #46 | Exceptional 14.1% |
| Immigrants | Moldova | 99.4 /100 | #47 | Exceptional 14.1% |
| Immigrants | Indonesia | 99.4 /100 | #48 | Exceptional 14.1% |
| Czechs | 99.3 /100 | #49 | Exceptional 14.1% |
| Italians | 99.2 /100 | #50 | Exceptional 14.2% |
| Immigrants | Greece | 99.2 /100 | #51 | Exceptional 14.2% |
| Laotians | 99.0 /100 | #52 | Exceptional 14.3% |
| Immigrants | Philippines | 99.0 /100 | #53 | Exceptional 14.3% |
| Immigrants | Serbia | 99.0 /100 | #54 | Exceptional 14.3% |
| Immigrants | Pakistan | 99.0 /100 | #55 | Exceptional 14.3% |
| Zimbabweans | 99.0 /100 | #56 | Exceptional 14.3% |