Immigrants from Jamaica vs German Female Poverty Among 18-24 Year Olds
COMPARE
Immigrants from Jamaica
German
Female Poverty Among 18-24 Year Olds
Female Poverty Among 18-24 Year Olds Comparison
Immigrants from Jamaica
Germans
18.9%
FEMALE POVERTY AMONG 18-24 YEAR OLDS
99.2/ 100
METRIC RATING
87th/ 347
METRIC RANK
20.4%
FEMALE POVERTY AMONG 18-24 YEAR OLDS
20.6/ 100
METRIC RATING
199th/ 347
METRIC RANK
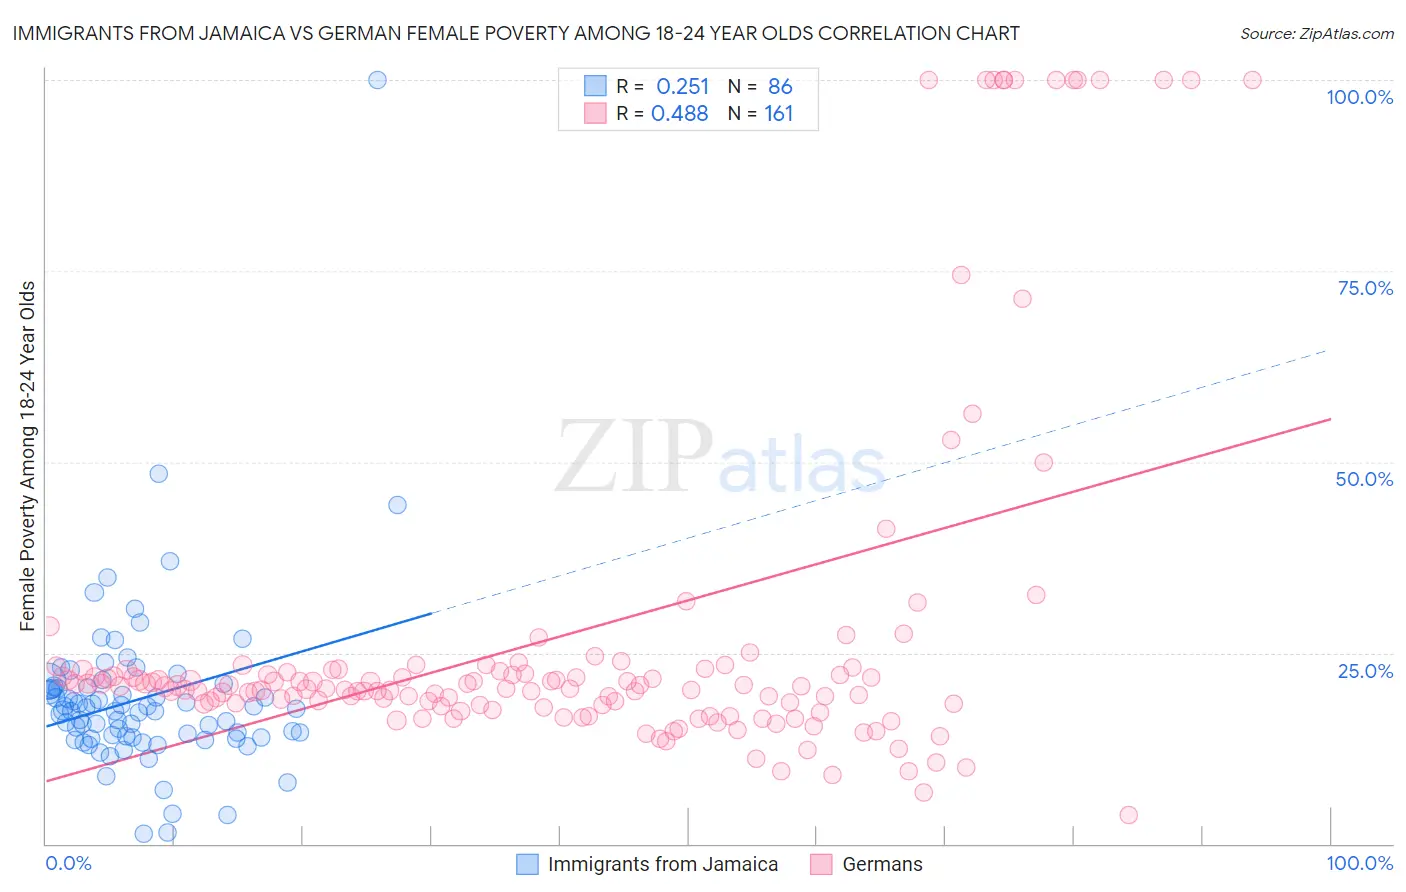
Immigrants from Jamaica vs German Female Poverty Among 18-24 Year Olds Correlation Chart
The statistical analysis conducted on geographies consisting of 296,183,759 people shows a weak positive correlation between the proportion of Immigrants from Jamaica and poverty level among females between the ages 18 and 24 in the United States with a correlation coefficient (R) of 0.251 and weighted average of 18.9%. Similarly, the statistical analysis conducted on geographies consisting of 542,897,180 people shows a moderate positive correlation between the proportion of Germans and poverty level among females between the ages 18 and 24 in the United States with a correlation coefficient (R) of 0.488 and weighted average of 20.4%, a difference of 7.9%.
Female Poverty Among 18-24 Year Olds Correlation Summary
| Measurement | Immigrants from Jamaica | German |
| Minimum | 1.3% | 3.7% |
| Maximum | 100.0% | 100.0% |
| Range | 98.7% | 96.3% |
| Mean | 19.0% | 27.4% |
| Median | 17.4% | 20.6% |
| Interquartile 25% (IQ1) | 14.0% | 18.2% |
| Interquartile 75% (IQ3) | 20.4% | 22.7% |
| Interquartile Range (IQR) | 6.5% | 4.5% |
| Standard Deviation (Sample) | 11.7% | 23.2% |
| Standard Deviation (Population) | 11.6% | 23.2% |
Similar Demographics by Female Poverty Among 18-24 Year Olds
Demographics Similar to Immigrants from Jamaica by Female Poverty Among 18-24 Year Olds
In terms of female poverty among 18-24 year olds, the demographic groups most similar to Immigrants from Jamaica are Immigrants from Iraq (18.9%, a difference of 0.010%), Immigrants from Armenia (18.9%, a difference of 0.090%), Burmese (18.9%, a difference of 0.12%), Croatian (19.0%, a difference of 0.15%), and Immigrants from Cabo Verde (19.0%, a difference of 0.17%).
| Demographics | Rating | Rank | Female Poverty Among 18-24 Year Olds |
| Palestinians | 99.5 /100 | #80 | Exceptional 18.8% |
| Japanese | 99.5 /100 | #81 | Exceptional 18.8% |
| Immigrants | Uruguay | 99.4 /100 | #82 | Exceptional 18.8% |
| Immigrants | Indonesia | 99.4 /100 | #83 | Exceptional 18.9% |
| Burmese | 99.2 /100 | #84 | Exceptional 18.9% |
| Immigrants | Armenia | 99.2 /100 | #85 | Exceptional 18.9% |
| Immigrants | Iraq | 99.2 /100 | #86 | Exceptional 18.9% |
| Immigrants | Jamaica | 99.2 /100 | #87 | Exceptional 18.9% |
| Croatians | 99.1 /100 | #88 | Exceptional 19.0% |
| Immigrants | Cabo Verde | 99.0 /100 | #89 | Exceptional 19.0% |
| Afghans | 99.0 /100 | #90 | Exceptional 19.0% |
| Romanians | 98.9 /100 | #91 | Exceptional 19.0% |
| Filipinos | 98.9 /100 | #92 | Exceptional 19.0% |
| Haitians | 98.9 /100 | #93 | Exceptional 19.0% |
| Ukrainians | 98.8 /100 | #94 | Exceptional 19.0% |
Demographics Similar to Germans by Female Poverty Among 18-24 Year Olds
In terms of female poverty among 18-24 year olds, the demographic groups most similar to Germans are Immigrants from Spain (20.4%, a difference of 0.010%), Zimbabwean (20.4%, a difference of 0.030%), European (20.4%, a difference of 0.050%), Czech (20.4%, a difference of 0.12%), and Immigrants from Latvia (20.4%, a difference of 0.17%).
| Demographics | Rating | Rank | Female Poverty Among 18-24 Year Olds |
| Immigrants | Israel | 24.4 /100 | #192 | Fair 20.4% |
| Nigerians | 23.4 /100 | #193 | Fair 20.4% |
| Mexican American Indians | 23.2 /100 | #194 | Fair 20.4% |
| Immigrants | Latvia | 23.0 /100 | #195 | Fair 20.4% |
| Czechs | 22.3 /100 | #196 | Fair 20.4% |
| Zimbabweans | 21.0 /100 | #197 | Fair 20.4% |
| Immigrants | Spain | 20.7 /100 | #198 | Fair 20.4% |
| Germans | 20.6 /100 | #199 | Fair 20.4% |
| Europeans | 19.9 /100 | #200 | Poor 20.4% |
| Mexicans | 18.3 /100 | #201 | Poor 20.5% |
| Immigrants | Turkey | 17.7 /100 | #202 | Poor 20.5% |
| Immigrants | Malaysia | 17.2 /100 | #203 | Poor 20.5% |
| Immigrants | Netherlands | 17.0 /100 | #204 | Poor 20.5% |
| English | 16.7 /100 | #205 | Poor 20.5% |
| Hispanics or Latinos | 16.6 /100 | #206 | Poor 20.5% |