Immigrants from Ireland vs Paraguayan Poverty
COMPARE
Immigrants from Ireland
Paraguayan
Poverty
Poverty Comparison
Immigrants from Ireland
Paraguayans
10.1%
POVERTY
99.9/ 100
METRIC RATING
5th/ 347
METRIC RANK
11.4%
POVERTY
94.9/ 100
METRIC RATING
94th/ 347
METRIC RANK
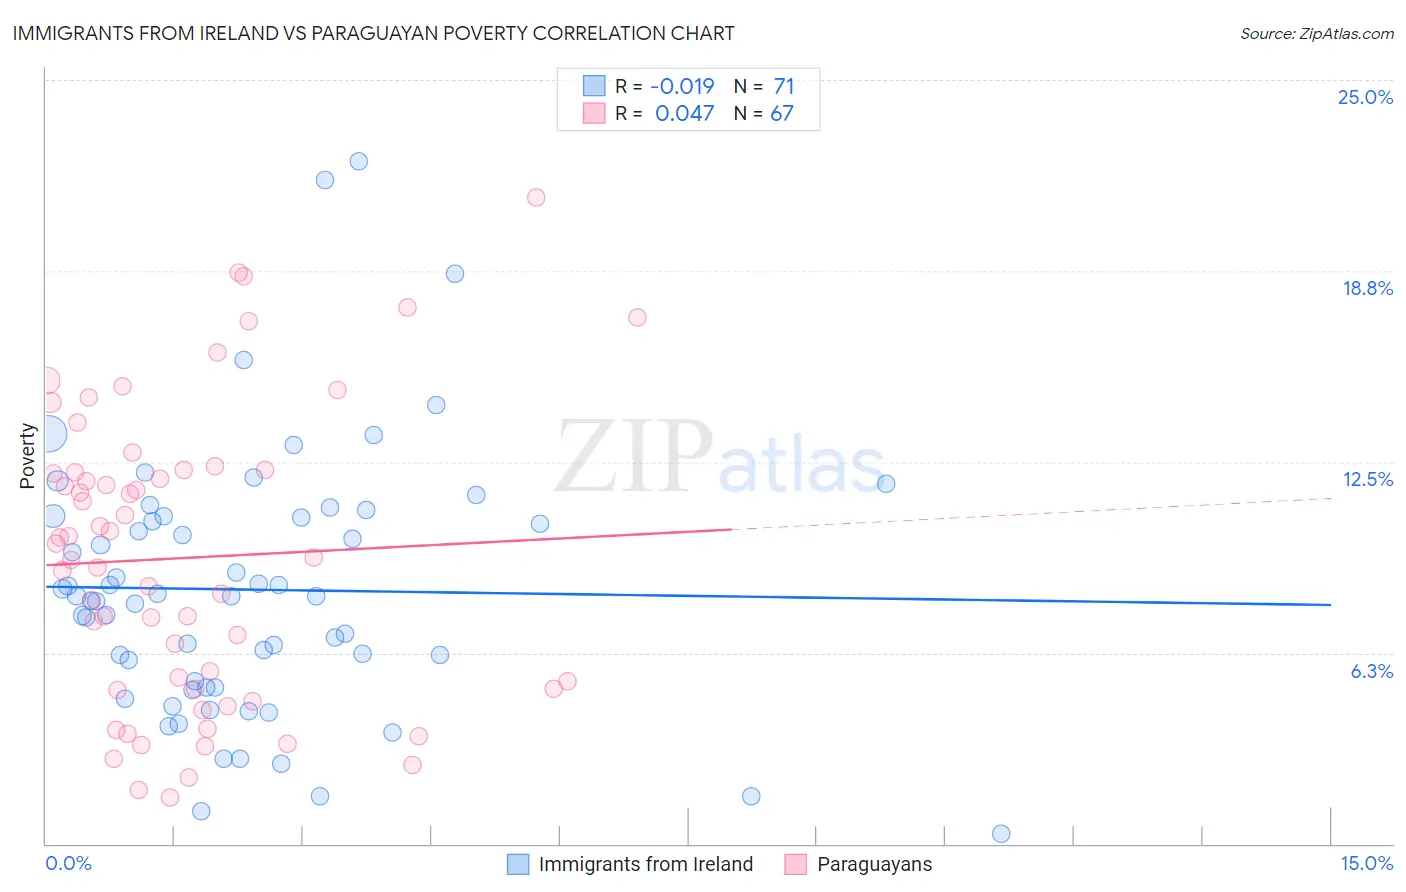
Immigrants from Ireland vs Paraguayan Poverty Correlation Chart
The statistical analysis conducted on geographies consisting of 240,745,110 people shows no correlation between the proportion of Immigrants from Ireland and poverty level in the United States with a correlation coefficient (R) of -0.019 and weighted average of 10.1%. Similarly, the statistical analysis conducted on geographies consisting of 95,102,151 people shows no correlation between the proportion of Paraguayans and poverty level in the United States with a correlation coefficient (R) of 0.047 and weighted average of 11.4%, a difference of 13.5%.
Poverty Correlation Summary
| Measurement | Immigrants from Ireland | Paraguayan |
| Minimum | 0.31% | 1.5% |
| Maximum | 22.3% | 21.1% |
| Range | 22.0% | 19.6% |
| Mean | 8.3% | 9.4% |
| Median | 8.1% | 9.4% |
| Interquartile 25% (IQ1) | 5.1% | 5.1% |
| Interquartile 75% (IQ3) | 10.7% | 12.2% |
| Interquartile Range (IQR) | 5.6% | 7.2% |
| Standard Deviation (Sample) | 4.3% | 4.8% |
| Standard Deviation (Population) | 4.3% | 4.8% |
Similar Demographics by Poverty
Demographics Similar to Immigrants from Ireland by Poverty
In terms of poverty, the demographic groups most similar to Immigrants from Ireland are Assyrian/Chaldean/Syriac (10.1%, a difference of 0.18%), Filipino (10.1%, a difference of 0.32%), Maltese (10.2%, a difference of 0.74%), Immigrants from South Central Asia (10.2%, a difference of 1.2%), and Bulgarian (10.2%, a difference of 1.6%).
| Demographics | Rating | Rank | Poverty |
| Immigrants | India | 100.0 /100 | #1 | Exceptional 9.0% |
| Chinese | 100.0 /100 | #2 | Exceptional 9.5% |
| Thais | 100.0 /100 | #3 | Exceptional 9.6% |
| Immigrants | Taiwan | 100.0 /100 | #4 | Exceptional 9.7% |
| Immigrants | Ireland | 99.9 /100 | #5 | Exceptional 10.1% |
| Assyrians/Chaldeans/Syriacs | 99.9 /100 | #6 | Exceptional 10.1% |
| Filipinos | 99.9 /100 | #7 | Exceptional 10.1% |
| Maltese | 99.9 /100 | #8 | Exceptional 10.2% |
| Immigrants | South Central Asia | 99.9 /100 | #9 | Exceptional 10.2% |
| Bulgarians | 99.9 /100 | #10 | Exceptional 10.2% |
| Immigrants | Lithuania | 99.9 /100 | #11 | Exceptional 10.3% |
| Bhutanese | 99.8 /100 | #12 | Exceptional 10.4% |
| Immigrants | Hong Kong | 99.8 /100 | #13 | Exceptional 10.4% |
| Immigrants | Bolivia | 99.8 /100 | #14 | Exceptional 10.4% |
| Bolivians | 99.8 /100 | #15 | Exceptional 10.4% |
Demographics Similar to Paraguayans by Poverty
In terms of poverty, the demographic groups most similar to Paraguayans are Australian (11.4%, a difference of 0.0%), Romanian (11.4%, a difference of 0.020%), British (11.4%, a difference of 0.060%), Immigrants from South Africa (11.5%, a difference of 0.12%), and Immigrants from Egypt (11.5%, a difference of 0.16%).
| Demographics | Rating | Rank | Poverty |
| Northern Europeans | 96.0 /100 | #87 | Exceptional 11.4% |
| Belgians | 95.8 /100 | #88 | Exceptional 11.4% |
| Czechoslovakians | 95.7 /100 | #89 | Exceptional 11.4% |
| Immigrants | Denmark | 95.5 /100 | #90 | Exceptional 11.4% |
| Finns | 95.2 /100 | #91 | Exceptional 11.4% |
| British | 95.0 /100 | #92 | Exceptional 11.4% |
| Romanians | 94.9 /100 | #93 | Exceptional 11.4% |
| Paraguayans | 94.9 /100 | #94 | Exceptional 11.4% |
| Australians | 94.9 /100 | #95 | Exceptional 11.4% |
| Immigrants | South Africa | 94.7 /100 | #96 | Exceptional 11.5% |
| Immigrants | Egypt | 94.6 /100 | #97 | Exceptional 11.5% |
| Immigrants | Latvia | 94.5 /100 | #98 | Exceptional 11.5% |
| Immigrants | Indonesia | 94.2 /100 | #99 | Exceptional 11.5% |
| Scottish | 94.0 /100 | #100 | Exceptional 11.5% |
| Slavs | 93.3 /100 | #101 | Exceptional 11.5% |