Immigrants from Ireland vs Immigrants from Dominican Republic Poverty
COMPARE
Immigrants from Ireland
Immigrants from Dominican Republic
Poverty
Poverty Comparison
Immigrants from Ireland
Immigrants from Dominican Republic
10.1%
POVERTY
99.9/ 100
METRIC RATING
5th/ 347
METRIC RANK
17.8%
POVERTY
0.0/ 100
METRIC RATING
331st/ 347
METRIC RANK
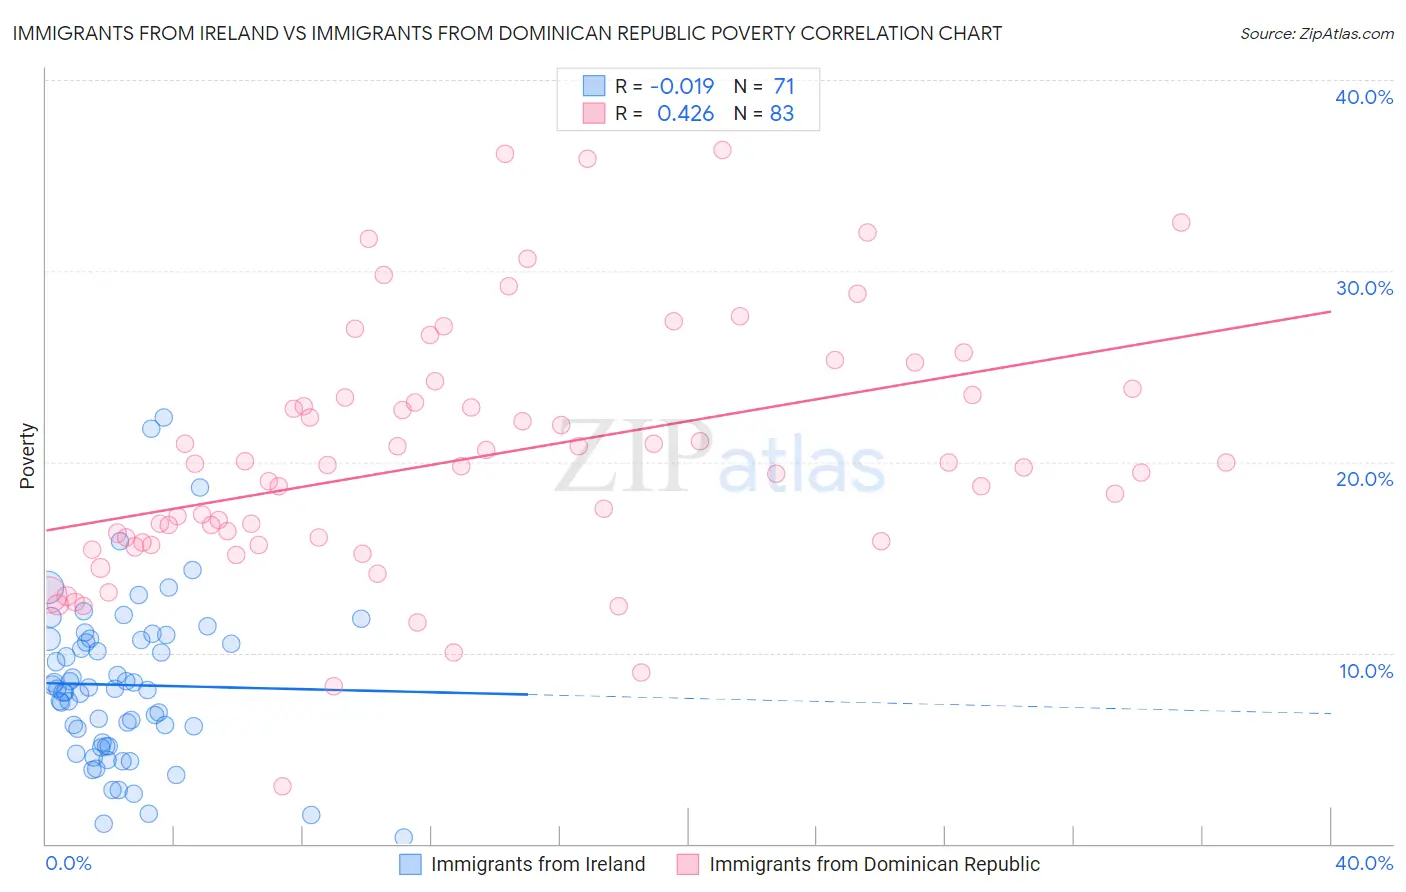
Immigrants from Ireland vs Immigrants from Dominican Republic Poverty Correlation Chart
The statistical analysis conducted on geographies consisting of 240,745,110 people shows no correlation between the proportion of Immigrants from Ireland and poverty level in the United States with a correlation coefficient (R) of -0.019 and weighted average of 10.1%. Similarly, the statistical analysis conducted on geographies consisting of 274,963,849 people shows a moderate positive correlation between the proportion of Immigrants from Dominican Republic and poverty level in the United States with a correlation coefficient (R) of 0.426 and weighted average of 17.8%, a difference of 76.5%.
Poverty Correlation Summary
| Measurement | Immigrants from Ireland | Immigrants from Dominican Republic |
| Minimum | 0.31% | 3.0% |
| Maximum | 22.3% | 36.4% |
| Range | 22.0% | 33.4% |
| Mean | 8.3% | 20.2% |
| Median | 8.1% | 19.8% |
| Interquartile 25% (IQ1) | 5.1% | 15.8% |
| Interquartile 75% (IQ3) | 10.7% | 23.5% |
| Interquartile Range (IQR) | 5.6% | 7.7% |
| Standard Deviation (Sample) | 4.3% | 6.5% |
| Standard Deviation (Population) | 4.3% | 6.5% |
Similar Demographics by Poverty
Demographics Similar to Immigrants from Ireland by Poverty
In terms of poverty, the demographic groups most similar to Immigrants from Ireland are Assyrian/Chaldean/Syriac (10.1%, a difference of 0.18%), Filipino (10.1%, a difference of 0.32%), Maltese (10.2%, a difference of 0.74%), Immigrants from South Central Asia (10.2%, a difference of 1.2%), and Bulgarian (10.2%, a difference of 1.6%).
| Demographics | Rating | Rank | Poverty |
| Immigrants | India | 100.0 /100 | #1 | Exceptional 9.0% |
| Chinese | 100.0 /100 | #2 | Exceptional 9.5% |
| Thais | 100.0 /100 | #3 | Exceptional 9.6% |
| Immigrants | Taiwan | 100.0 /100 | #4 | Exceptional 9.7% |
| Immigrants | Ireland | 99.9 /100 | #5 | Exceptional 10.1% |
| Assyrians/Chaldeans/Syriacs | 99.9 /100 | #6 | Exceptional 10.1% |
| Filipinos | 99.9 /100 | #7 | Exceptional 10.1% |
| Maltese | 99.9 /100 | #8 | Exceptional 10.2% |
| Immigrants | South Central Asia | 99.9 /100 | #9 | Exceptional 10.2% |
| Bulgarians | 99.9 /100 | #10 | Exceptional 10.2% |
| Immigrants | Lithuania | 99.9 /100 | #11 | Exceptional 10.3% |
| Bhutanese | 99.8 /100 | #12 | Exceptional 10.4% |
| Immigrants | Hong Kong | 99.8 /100 | #13 | Exceptional 10.4% |
| Immigrants | Bolivia | 99.8 /100 | #14 | Exceptional 10.4% |
| Bolivians | 99.8 /100 | #15 | Exceptional 10.4% |
Demographics Similar to Immigrants from Dominican Republic by Poverty
In terms of poverty, the demographic groups most similar to Immigrants from Dominican Republic are Dominican (17.6%, a difference of 0.92%), Native/Alaskan (18.1%, a difference of 1.4%), Black/African American (17.3%, a difference of 3.2%), Houma (18.4%, a difference of 3.5%), and Apache (18.4%, a difference of 3.5%).
| Demographics | Rating | Rank | Poverty |
| Yakama | 0.0 /100 | #324 | Tragic 16.7% |
| Central American Indians | 0.0 /100 | #325 | Tragic 16.7% |
| Paiute | 0.0 /100 | #326 | Tragic 16.7% |
| Kiowa | 0.0 /100 | #327 | Tragic 16.8% |
| Ute | 0.0 /100 | #328 | Tragic 16.9% |
| Blacks/African Americans | 0.0 /100 | #329 | Tragic 17.3% |
| Dominicans | 0.0 /100 | #330 | Tragic 17.6% |
| Immigrants | Dominican Republic | 0.0 /100 | #331 | Tragic 17.8% |
| Natives/Alaskans | 0.0 /100 | #332 | Tragic 18.1% |
| Houma | 0.0 /100 | #333 | Tragic 18.4% |
| Apache | 0.0 /100 | #334 | Tragic 18.4% |
| Cheyenne | 0.0 /100 | #335 | Tragic 18.9% |
| Pueblo | 0.0 /100 | #336 | Tragic 19.4% |
| Sioux | 0.0 /100 | #337 | Tragic 19.8% |
| Yuman | 0.0 /100 | #338 | Tragic 20.2% |