Immigrants from Iraq vs Immigrants from Germany In Labor Force | Age 30-34
COMPARE
Immigrants from Iraq
Immigrants from Germany
In Labor Force | Age 30-34
In Labor Force | Age 30-34 Comparison
Immigrants from Iraq
Immigrants from Germany
83.9%
IN LABOR FORCE | AGE 30-34
0.7/ 100
METRIC RATING
250th/ 347
METRIC RANK
84.3%
IN LABOR FORCE | AGE 30-34
7.2/ 100
METRIC RATING
214th/ 347
METRIC RANK
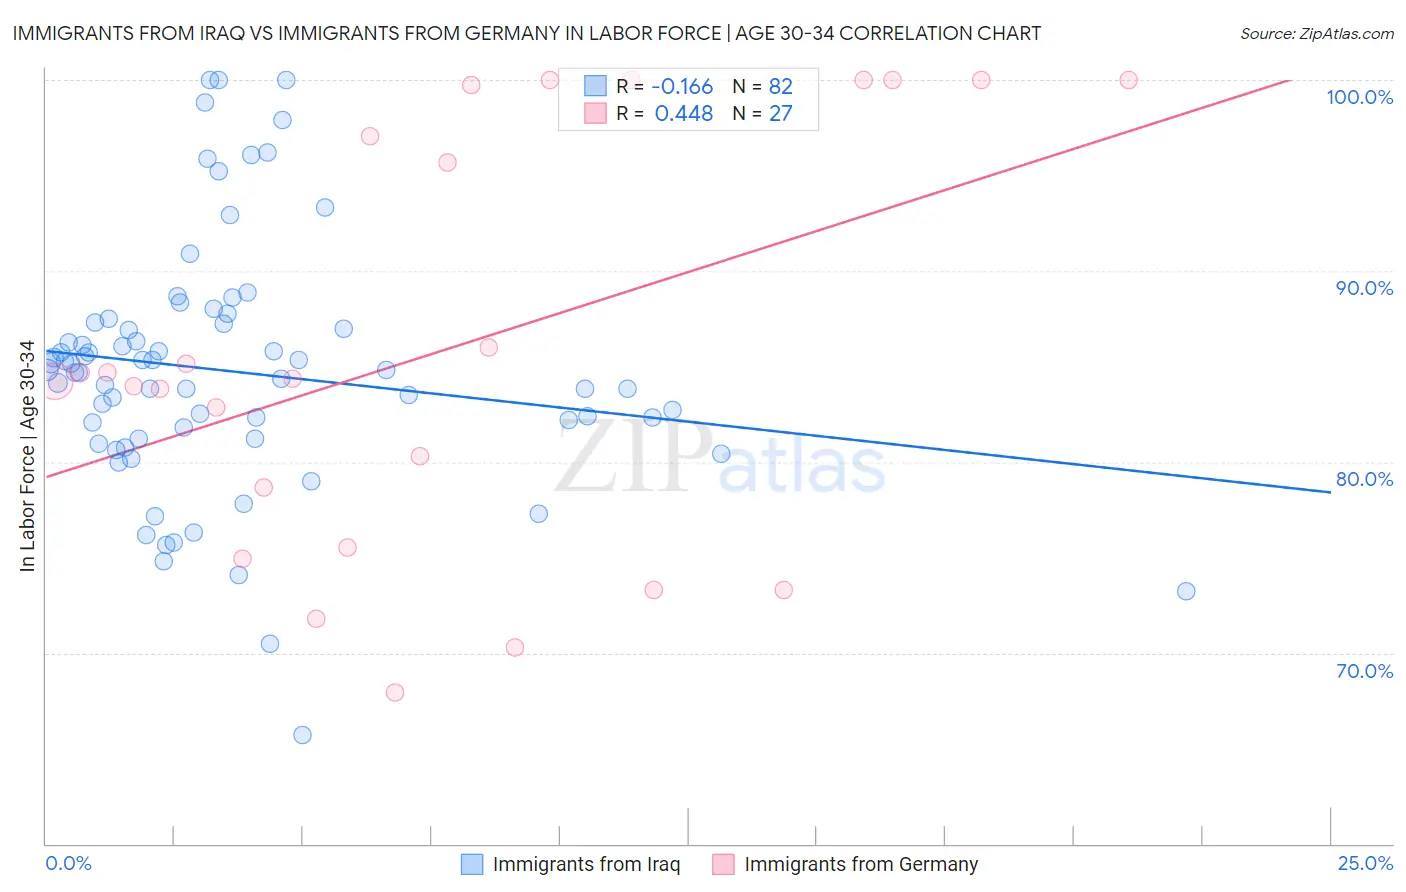
Immigrants from Iraq vs Immigrants from Germany In Labor Force | Age 30-34 Correlation Chart
The statistical analysis conducted on geographies consisting of 194,759,411 people shows a poor negative correlation between the proportion of Immigrants from Iraq and labor force participation rate among population between the ages 30 and 34 in the United States with a correlation coefficient (R) of -0.166 and weighted average of 83.9%. Similarly, the statistical analysis conducted on geographies consisting of 463,598,639 people shows a moderate positive correlation between the proportion of Immigrants from Germany and labor force participation rate among population between the ages 30 and 34 in the United States with a correlation coefficient (R) of 0.448 and weighted average of 84.3%, a difference of 0.44%.
In Labor Force | Age 30-34 Correlation Summary
| Measurement | Immigrants from Iraq | Immigrants from Germany |
| Minimum | 65.7% | 67.9% |
| Maximum | 100.0% | 100.0% |
| Range | 34.3% | 32.1% |
| Mean | 84.7% | 85.9% |
| Median | 84.8% | 84.4% |
| Interquartile 25% (IQ1) | 81.2% | 75.5% |
| Interquartile 75% (IQ3) | 87.3% | 99.7% |
| Interquartile Range (IQR) | 6.0% | 24.2% |
| Standard Deviation (Sample) | 6.6% | 10.8% |
| Standard Deviation (Population) | 6.5% | 10.6% |
Similar Demographics by In Labor Force | Age 30-34
Demographics Similar to Immigrants from Iraq by In Labor Force | Age 30-34
In terms of in labor force | age 30-34, the demographic groups most similar to Immigrants from Iraq are Portuguese (84.0%, a difference of 0.020%), Immigrants from Dominica (84.0%, a difference of 0.020%), Nicaraguan (83.9%, a difference of 0.020%), Bahamian (83.9%, a difference of 0.020%), and Immigrants from Nicaragua (83.9%, a difference of 0.020%).
| Demographics | Rating | Rank | In Labor Force | Age 30-34 |
| Immigrants | Caribbean | 1.1 /100 | #243 | Tragic 84.0% |
| Basques | 0.9 /100 | #244 | Tragic 84.0% |
| Immigrants | Venezuela | 0.9 /100 | #245 | Tragic 84.0% |
| Central Americans | 0.9 /100 | #246 | Tragic 84.0% |
| British West Indians | 0.8 /100 | #247 | Tragic 84.0% |
| Portuguese | 0.8 /100 | #248 | Tragic 84.0% |
| Immigrants | Dominica | 0.7 /100 | #249 | Tragic 84.0% |
| Immigrants | Iraq | 0.7 /100 | #250 | Tragic 83.9% |
| Nicaraguans | 0.6 /100 | #251 | Tragic 83.9% |
| Bahamians | 0.6 /100 | #252 | Tragic 83.9% |
| Immigrants | Nicaragua | 0.6 /100 | #253 | Tragic 83.9% |
| Immigrants | St. Vincent and the Grenadines | 0.5 /100 | #254 | Tragic 83.9% |
| Whites/Caucasians | 0.5 /100 | #255 | Tragic 83.9% |
| Immigrants | Lebanon | 0.4 /100 | #256 | Tragic 83.9% |
| Iraqis | 0.3 /100 | #257 | Tragic 83.8% |
Demographics Similar to Immigrants from Germany by In Labor Force | Age 30-34
In terms of in labor force | age 30-34, the demographic groups most similar to Immigrants from Germany are European (84.3%, a difference of 0.0%), Immigrants from Ecuador (84.3%, a difference of 0.0%), Immigrants from Trinidad and Tobago (84.3%, a difference of 0.010%), Immigrants from Western Asia (84.3%, a difference of 0.020%), and Immigrants from Jamaica (84.3%, a difference of 0.020%).
| Demographics | Rating | Rank | In Labor Force | Age 30-34 |
| Bangladeshis | 9.4 /100 | #207 | Tragic 84.3% |
| Arabs | 8.9 /100 | #208 | Tragic 84.3% |
| Jamaicans | 8.8 /100 | #209 | Tragic 84.3% |
| Indonesians | 8.8 /100 | #210 | Tragic 84.3% |
| Japanese | 8.8 /100 | #211 | Tragic 84.3% |
| Immigrants | Western Asia | 8.2 /100 | #212 | Tragic 84.3% |
| Immigrants | Jamaica | 7.9 /100 | #213 | Tragic 84.3% |
| Immigrants | Germany | 7.2 /100 | #214 | Tragic 84.3% |
| Europeans | 7.2 /100 | #215 | Tragic 84.3% |
| Immigrants | Ecuador | 7.1 /100 | #216 | Tragic 84.3% |
| Immigrants | Trinidad and Tobago | 7.0 /100 | #217 | Tragic 84.3% |
| Immigrants | Panama | 6.3 /100 | #218 | Tragic 84.3% |
| Swiss | 5.8 /100 | #219 | Tragic 84.3% |
| Danes | 5.3 /100 | #220 | Tragic 84.3% |
| Salvadorans | 3.8 /100 | #221 | Tragic 84.2% |