Immigrants from Iraq vs Immigrants from Germany In Labor Force | Age 35-44
COMPARE
Immigrants from Iraq
Immigrants from Germany
In Labor Force | Age 35-44
In Labor Force | Age 35-44 Comparison
Immigrants from Iraq
Immigrants from Germany
83.9%
IN LABOR FORCE | AGE 35-44
3.7/ 100
METRIC RATING
230th/ 347
METRIC RANK
83.9%
IN LABOR FORCE | AGE 35-44
2.8/ 100
METRIC RATING
233rd/ 347
METRIC RANK
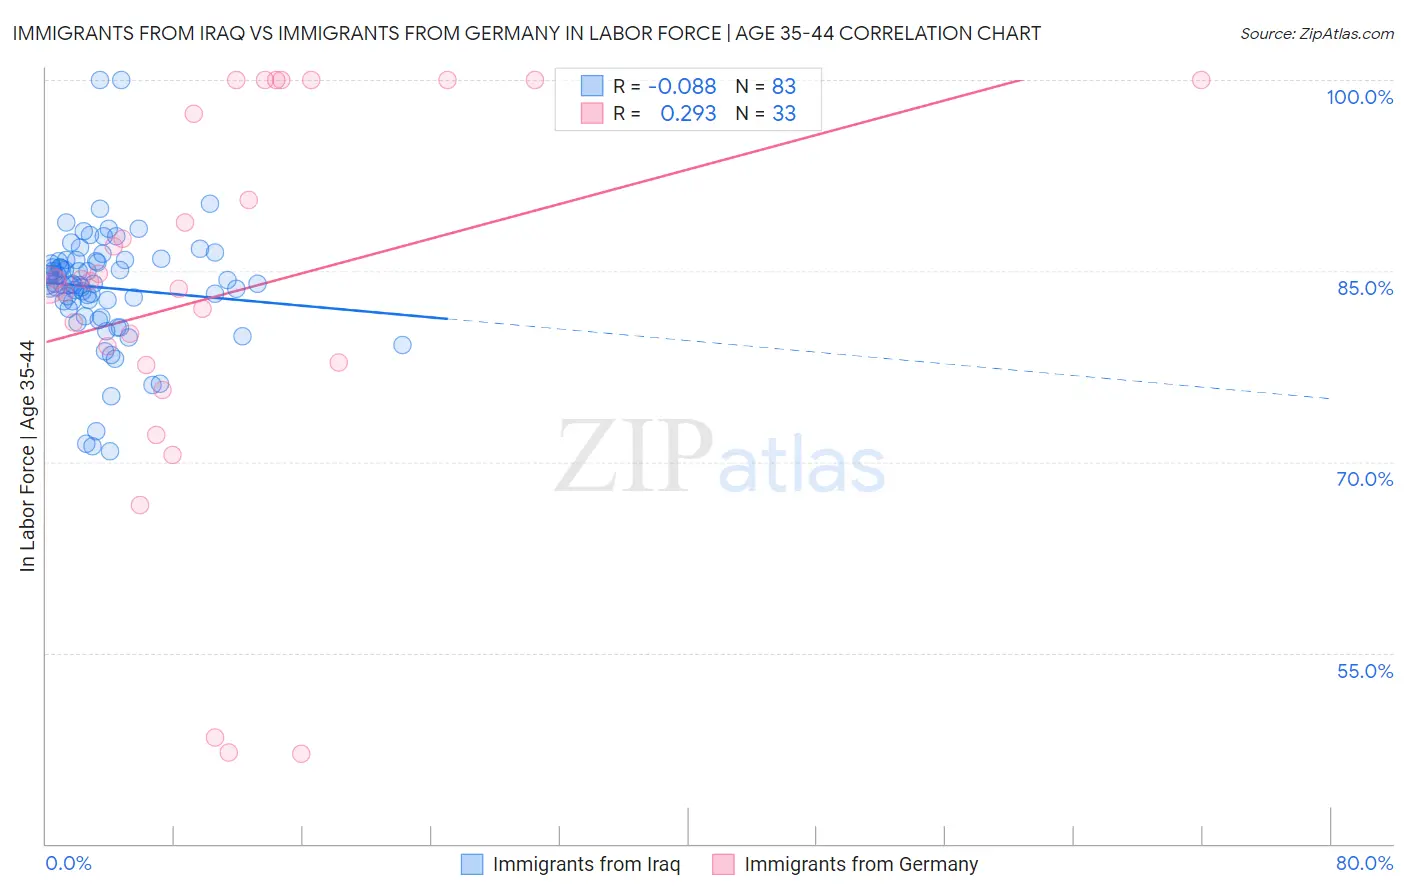
Immigrants from Iraq vs Immigrants from Germany In Labor Force | Age 35-44 Correlation Chart
The statistical analysis conducted on geographies consisting of 194,714,153 people shows a slight negative correlation between the proportion of Immigrants from Iraq and labor force participation rate among population between the ages 35 and 44 in the United States with a correlation coefficient (R) of -0.088 and weighted average of 83.9%. Similarly, the statistical analysis conducted on geographies consisting of 463,742,889 people shows a weak positive correlation between the proportion of Immigrants from Germany and labor force participation rate among population between the ages 35 and 44 in the United States with a correlation coefficient (R) of 0.293 and weighted average of 83.9%, a difference of 0.040%.
In Labor Force | Age 35-44 Correlation Summary
| Measurement | Immigrants from Iraq | Immigrants from Germany |
| Minimum | 70.8% | 47.1% |
| Maximum | 100.0% | 100.0% |
| Range | 29.2% | 52.9% |
| Mean | 83.7% | 83.2% |
| Median | 84.0% | 84.2% |
| Interquartile 25% (IQ1) | 82.0% | 77.7% |
| Interquartile 75% (IQ3) | 85.8% | 98.7% |
| Interquartile Range (IQR) | 3.8% | 21.0% |
| Standard Deviation (Sample) | 4.7% | 14.9% |
| Standard Deviation (Population) | 4.7% | 14.7% |
Demographics Similar to Immigrants from Iraq and Immigrants from Germany by In Labor Force | Age 35-44
In terms of in labor force | age 35-44, the demographic groups most similar to Immigrants from Iraq are Scottish (83.9%, a difference of 0.030%), Immigrants from Thailand (84.0%, a difference of 0.040%), Native Hawaiian (83.9%, a difference of 0.040%), British West Indian (84.0%, a difference of 0.060%), and Welsh (84.0%, a difference of 0.060%). Similarly, the demographic groups most similar to Immigrants from Germany are Native Hawaiian (83.9%, a difference of 0.010%), Immigrants from Oceania (83.9%, a difference of 0.010%), Scottish (83.9%, a difference of 0.020%), Immigrants from Syria (83.9%, a difference of 0.020%), and West Indian (83.9%, a difference of 0.030%).
| Demographics | Rating | Rank | In Labor Force | Age 35-44 |
| Icelanders | 6.7 /100 | #221 | Tragic 84.0% |
| Assyrians/Chaldeans/Syriacs | 6.6 /100 | #222 | Tragic 84.0% |
| Immigrants | Panama | 6.4 /100 | #223 | Tragic 84.0% |
| U.S. Virgin Islanders | 6.1 /100 | #224 | Tragic 84.0% |
| Immigrants | Burma/Myanmar | 6.1 /100 | #225 | Tragic 84.0% |
| Panamanians | 5.4 /100 | #226 | Tragic 84.0% |
| British West Indians | 5.3 /100 | #227 | Tragic 84.0% |
| Welsh | 5.3 /100 | #228 | Tragic 84.0% |
| Immigrants | Thailand | 4.7 /100 | #229 | Tragic 84.0% |
| Immigrants | Iraq | 3.7 /100 | #230 | Tragic 83.9% |
| Scottish | 3.2 /100 | #231 | Tragic 83.9% |
| Native Hawaiians | 3.0 /100 | #232 | Tragic 83.9% |
| Immigrants | Germany | 2.8 /100 | #233 | Tragic 83.9% |
| Immigrants | Oceania | 2.6 /100 | #234 | Tragic 83.9% |
| Immigrants | Syria | 2.5 /100 | #235 | Tragic 83.9% |
| West Indians | 2.4 /100 | #236 | Tragic 83.9% |
| English | 1.8 /100 | #237 | Tragic 83.8% |
| Immigrants | Laos | 1.7 /100 | #238 | Tragic 83.8% |
| Celtics | 1.4 /100 | #239 | Tragic 83.8% |
| Arabs | 1.3 /100 | #240 | Tragic 83.8% |
| Iraqis | 1.3 /100 | #241 | Tragic 83.8% |