Polish vs Immigrants from Egypt Seniors Poverty Over the Age of 75
COMPARE
Polish
Immigrants from Egypt
Seniors Poverty Over the Age of 75
Seniors Poverty Over the Age of 75 Comparison
Poles
Immigrants from Egypt
10.6%
SENIORS POVERTY OVER THE AGE OF 75
99.8/ 100
METRIC RATING
24th/ 347
METRIC RANK
12.2%
SENIORS POVERTY OVER THE AGE OF 75
53.7/ 100
METRIC RATING
169th/ 347
METRIC RANK
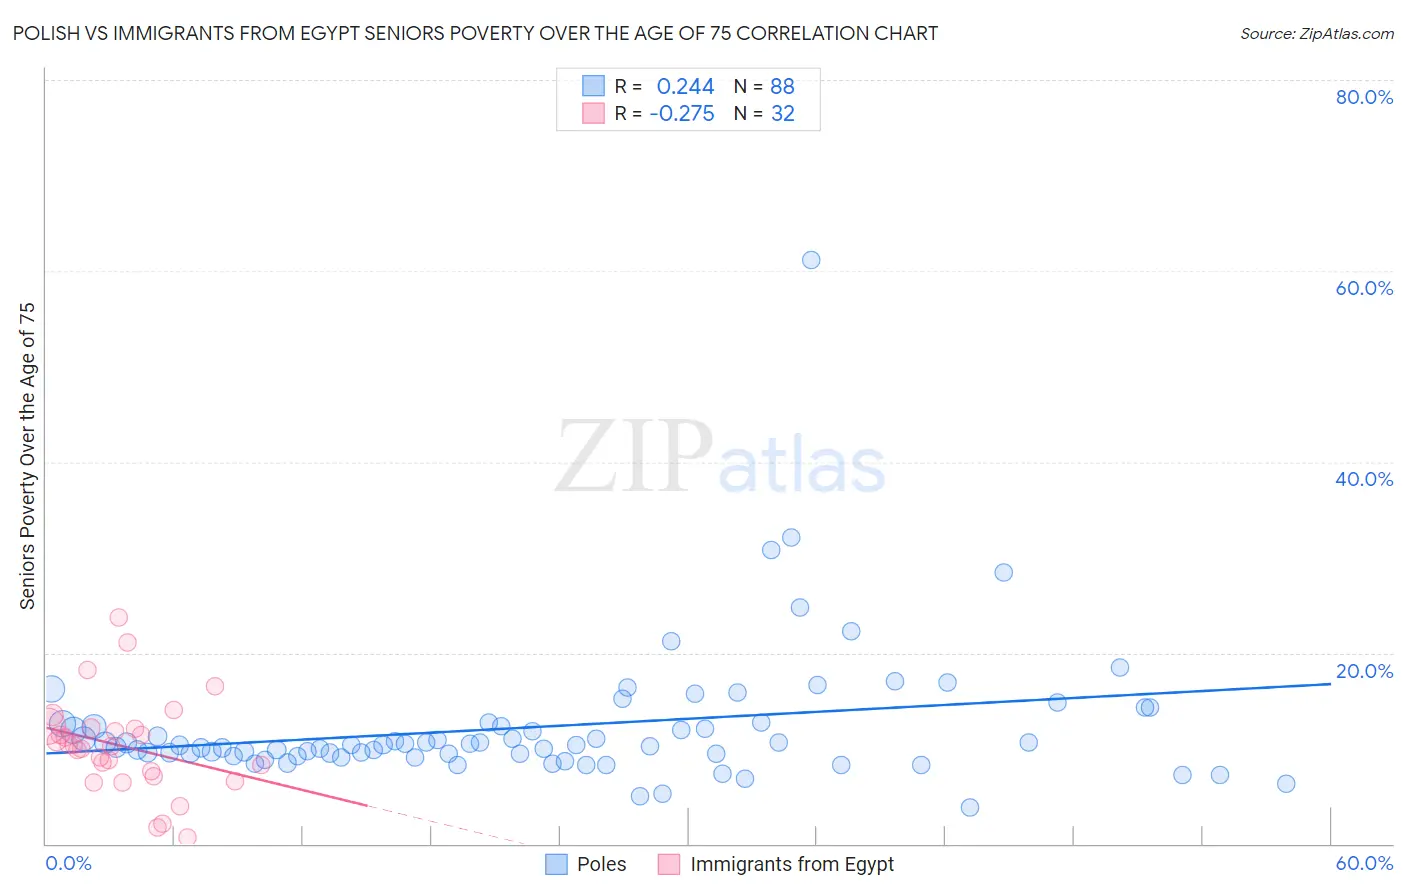
Polish vs Immigrants from Egypt Seniors Poverty Over the Age of 75 Correlation Chart
The statistical analysis conducted on geographies consisting of 544,555,303 people shows a weak positive correlation between the proportion of Poles and poverty level among seniors over the age of 75 in the United States with a correlation coefficient (R) of 0.244 and weighted average of 10.6%. Similarly, the statistical analysis conducted on geographies consisting of 243,675,721 people shows a weak negative correlation between the proportion of Immigrants from Egypt and poverty level among seniors over the age of 75 in the United States with a correlation coefficient (R) of -0.275 and weighted average of 12.2%, a difference of 14.7%.
Seniors Poverty Over the Age of 75 Correlation Summary
| Measurement | Polish | Immigrants from Egypt |
| Minimum | 3.8% | 0.66% |
| Maximum | 61.1% | 23.7% |
| Range | 57.3% | 23.1% |
| Mean | 12.3% | 10.2% |
| Median | 10.3% | 10.3% |
| Interquartile 25% (IQ1) | 9.3% | 7.3% |
| Interquartile 75% (IQ3) | 12.4% | 12.1% |
| Interquartile Range (IQR) | 3.2% | 4.8% |
| Standard Deviation (Sample) | 7.3% | 5.0% |
| Standard Deviation (Population) | 7.2% | 5.0% |
Similar Demographics by Seniors Poverty Over the Age of 75
Demographics Similar to Poles by Seniors Poverty Over the Age of 75
In terms of seniors poverty over the age of 75, the demographic groups most similar to Poles are Menominee (10.6%, a difference of 0.020%), Lithuanian (10.6%, a difference of 0.070%), Bhutanese (10.6%, a difference of 0.090%), Slovene (10.6%, a difference of 0.35%), and Czech (10.5%, a difference of 0.39%).
| Demographics | Rating | Rank | Seniors Poverty Over the Age of 75 |
| Slovaks | 99.9 /100 | #17 | Exceptional 10.5% |
| Welsh | 99.9 /100 | #18 | Exceptional 10.5% |
| Immigrants | Scotland | 99.9 /100 | #19 | Exceptional 10.5% |
| Czechs | 99.9 /100 | #20 | Exceptional 10.5% |
| Slovenes | 99.9 /100 | #21 | Exceptional 10.6% |
| Bhutanese | 99.8 /100 | #22 | Exceptional 10.6% |
| Lithuanians | 99.8 /100 | #23 | Exceptional 10.6% |
| Poles | 99.8 /100 | #24 | Exceptional 10.6% |
| Menominee | 99.8 /100 | #25 | Exceptional 10.6% |
| Bulgarians | 99.8 /100 | #26 | Exceptional 10.7% |
| Northern Europeans | 99.8 /100 | #27 | Exceptional 10.7% |
| Irish | 99.8 /100 | #28 | Exceptional 10.7% |
| Assyrians/Chaldeans/Syriacs | 99.8 /100 | #29 | Exceptional 10.7% |
| Swiss | 99.7 /100 | #30 | Exceptional 10.7% |
| Marshallese | 99.7 /100 | #31 | Exceptional 10.7% |
Demographics Similar to Immigrants from Egypt by Seniors Poverty Over the Age of 75
In terms of seniors poverty over the age of 75, the demographic groups most similar to Immigrants from Egypt are Immigrants from Syria (12.2%, a difference of 0.010%), Immigrants from Switzerland (12.1%, a difference of 0.070%), Egyptian (12.1%, a difference of 0.090%), Immigrants from Thailand (12.2%, a difference of 0.14%), and Spaniard (12.2%, a difference of 0.18%).
| Demographics | Rating | Rank | Seniors Poverty Over the Age of 75 |
| Immigrants | Serbia | 60.2 /100 | #162 | Good 12.1% |
| Immigrants | Greece | 58.2 /100 | #163 | Average 12.1% |
| Potawatomi | 57.4 /100 | #164 | Average 12.1% |
| Okinawans | 56.3 /100 | #165 | Average 12.1% |
| Egyptians | 54.8 /100 | #166 | Average 12.1% |
| Immigrants | Switzerland | 54.5 /100 | #167 | Average 12.1% |
| Immigrants | Syria | 53.9 /100 | #168 | Average 12.2% |
| Immigrants | Egypt | 53.7 /100 | #169 | Average 12.2% |
| Immigrants | Thailand | 52.0 /100 | #170 | Average 12.2% |
| Spaniards | 51.6 /100 | #171 | Average 12.2% |
| Immigrants | Fiji | 51.5 /100 | #172 | Average 12.2% |
| Arabs | 50.5 /100 | #173 | Average 12.2% |
| Immigrants | Europe | 50.0 /100 | #174 | Average 12.2% |
| Immigrants | Saudi Arabia | 49.5 /100 | #175 | Average 12.2% |
| Immigrants | Iran | 48.1 /100 | #176 | Average 12.2% |