Austrian vs Immigrants from Guatemala Seniors Poverty Over the Age of 75
COMPARE
Austrian
Immigrants from Guatemala
Seniors Poverty Over the Age of 75
Seniors Poverty Over the Age of 75 Comparison
Austrians
Immigrants from Guatemala
11.0%
SENIORS POVERTY OVER THE AGE OF 75
99.1/ 100
METRIC RATING
42nd/ 347
METRIC RANK
15.1%
SENIORS POVERTY OVER THE AGE OF 75
0.0/ 100
METRIC RATING
287th/ 347
METRIC RANK
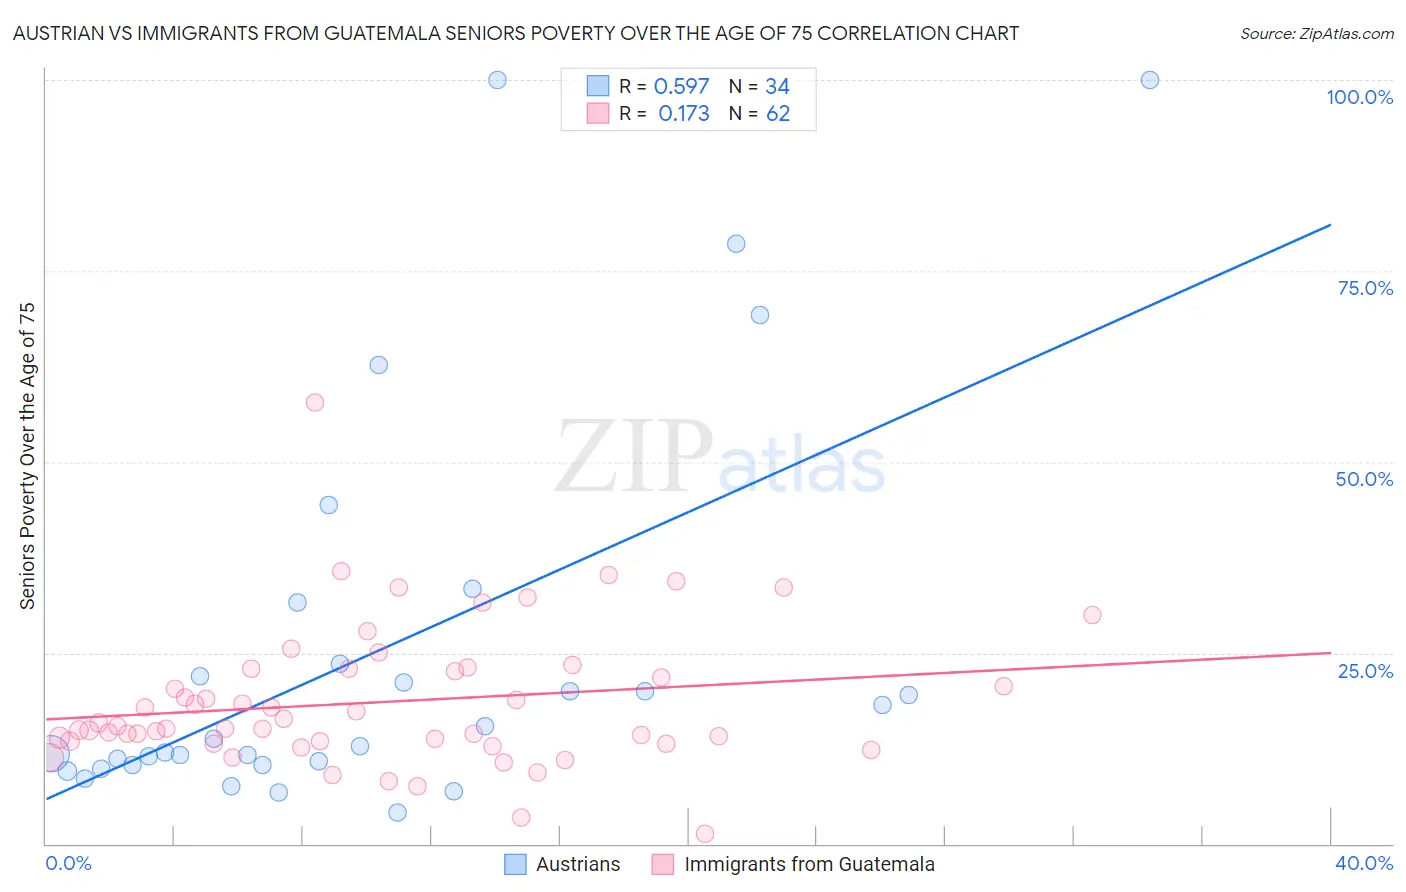
Austrian vs Immigrants from Guatemala Seniors Poverty Over the Age of 75 Correlation Chart
The statistical analysis conducted on geographies consisting of 444,924,012 people shows a substantial positive correlation between the proportion of Austrians and poverty level among seniors over the age of 75 in the United States with a correlation coefficient (R) of 0.597 and weighted average of 11.0%. Similarly, the statistical analysis conducted on geographies consisting of 373,963,984 people shows a poor positive correlation between the proportion of Immigrants from Guatemala and poverty level among seniors over the age of 75 in the United States with a correlation coefficient (R) of 0.173 and weighted average of 15.1%, a difference of 36.7%.
Seniors Poverty Over the Age of 75 Correlation Summary
| Measurement | Austrian | Immigrants from Guatemala |
| Minimum | 4.1% | 1.2% |
| Maximum | 100.0% | 57.8% |
| Range | 95.9% | 56.5% |
| Mean | 25.3% | 18.6% |
| Median | 13.3% | 15.2% |
| Interquartile 25% (IQ1) | 10.3% | 13.4% |
| Interquartile 75% (IQ3) | 23.5% | 22.9% |
| Interquartile Range (IQR) | 13.2% | 9.5% |
| Standard Deviation (Sample) | 26.0% | 9.3% |
| Standard Deviation (Population) | 25.7% | 9.2% |
Similar Demographics by Seniors Poverty Over the Age of 75
Demographics Similar to Austrians by Seniors Poverty Over the Age of 75
In terms of seniors poverty over the age of 75, the demographic groups most similar to Austrians are Celtic (11.0%, a difference of 0.050%), Belgian (11.0%, a difference of 0.080%), Immigrants from Lithuania (11.0%, a difference of 0.27%), Carpatho Rusyn (11.1%, a difference of 0.35%), and Greek (11.1%, a difference of 0.42%).
| Demographics | Rating | Rank | Seniors Poverty Over the Age of 75 |
| Luxembourgers | 99.6 /100 | #35 | Exceptional 10.8% |
| Scotch-Irish | 99.6 /100 | #36 | Exceptional 10.8% |
| Latvians | 99.6 /100 | #37 | Exceptional 10.8% |
| Finns | 99.6 /100 | #38 | Exceptional 10.8% |
| Czechoslovakians | 99.4 /100 | #39 | Exceptional 10.9% |
| Thais | 99.4 /100 | #40 | Exceptional 10.9% |
| Immigrants | Lithuania | 99.2 /100 | #41 | Exceptional 11.0% |
| Austrians | 99.1 /100 | #42 | Exceptional 11.0% |
| Celtics | 99.1 /100 | #43 | Exceptional 11.0% |
| Belgians | 99.1 /100 | #44 | Exceptional 11.0% |
| Carpatho Rusyns | 99.0 /100 | #45 | Exceptional 11.1% |
| Greeks | 99.0 /100 | #46 | Exceptional 11.1% |
| Hawaiians | 98.8 /100 | #47 | Exceptional 11.1% |
| French | 98.7 /100 | #48 | Exceptional 11.1% |
| Samoans | 98.7 /100 | #49 | Exceptional 11.1% |
Demographics Similar to Immigrants from Guatemala by Seniors Poverty Over the Age of 75
In terms of seniors poverty over the age of 75, the demographic groups most similar to Immigrants from Guatemala are Immigrants from Central America (15.0%, a difference of 0.59%), Jamaican (15.1%, a difference of 0.60%), Immigrants from Belize (15.2%, a difference of 0.86%), Immigrants from the Azores (15.2%, a difference of 0.88%), and Paiute (15.2%, a difference of 0.89%).
| Demographics | Rating | Rank | Seniors Poverty Over the Age of 75 |
| Central Americans | 0.0 /100 | #280 | Tragic 14.7% |
| Belizeans | 0.0 /100 | #281 | Tragic 14.8% |
| Immigrants | Senegal | 0.0 /100 | #282 | Tragic 14.8% |
| Guatemalans | 0.0 /100 | #283 | Tragic 14.8% |
| Cheyenne | 0.0 /100 | #284 | Tragic 14.9% |
| Immigrants | Mexico | 0.0 /100 | #285 | Tragic 14.9% |
| Immigrants | Central America | 0.0 /100 | #286 | Tragic 15.0% |
| Immigrants | Guatemala | 0.0 /100 | #287 | Tragic 15.1% |
| Jamaicans | 0.0 /100 | #288 | Tragic 15.1% |
| Immigrants | Belize | 0.0 /100 | #289 | Tragic 15.2% |
| Immigrants | Azores | 0.0 /100 | #290 | Tragic 15.2% |
| Paiute | 0.0 /100 | #291 | Tragic 15.2% |
| Colville | 0.0 /100 | #292 | Tragic 15.2% |
| Apache | 0.0 /100 | #293 | Tragic 15.3% |
| Immigrants | Jamaica | 0.0 /100 | #294 | Tragic 15.3% |