Immigrants from Hong Kong vs Russian Child Poverty Among Boys Under 16
COMPARE
Immigrants from Hong Kong
Russian
Child Poverty Among Boys Under 16
Child Poverty Among Boys Under 16 Comparison
Immigrants from Hong Kong
Russians
12.3%
CHILD POVERTY AMONG BOYS UNDER 16
100.0/ 100
METRIC RATING
6th/ 347
METRIC RANK
13.8%
CHILD POVERTY AMONG BOYS UNDER 16
99.7/ 100
METRIC RATING
35th/ 347
METRIC RANK
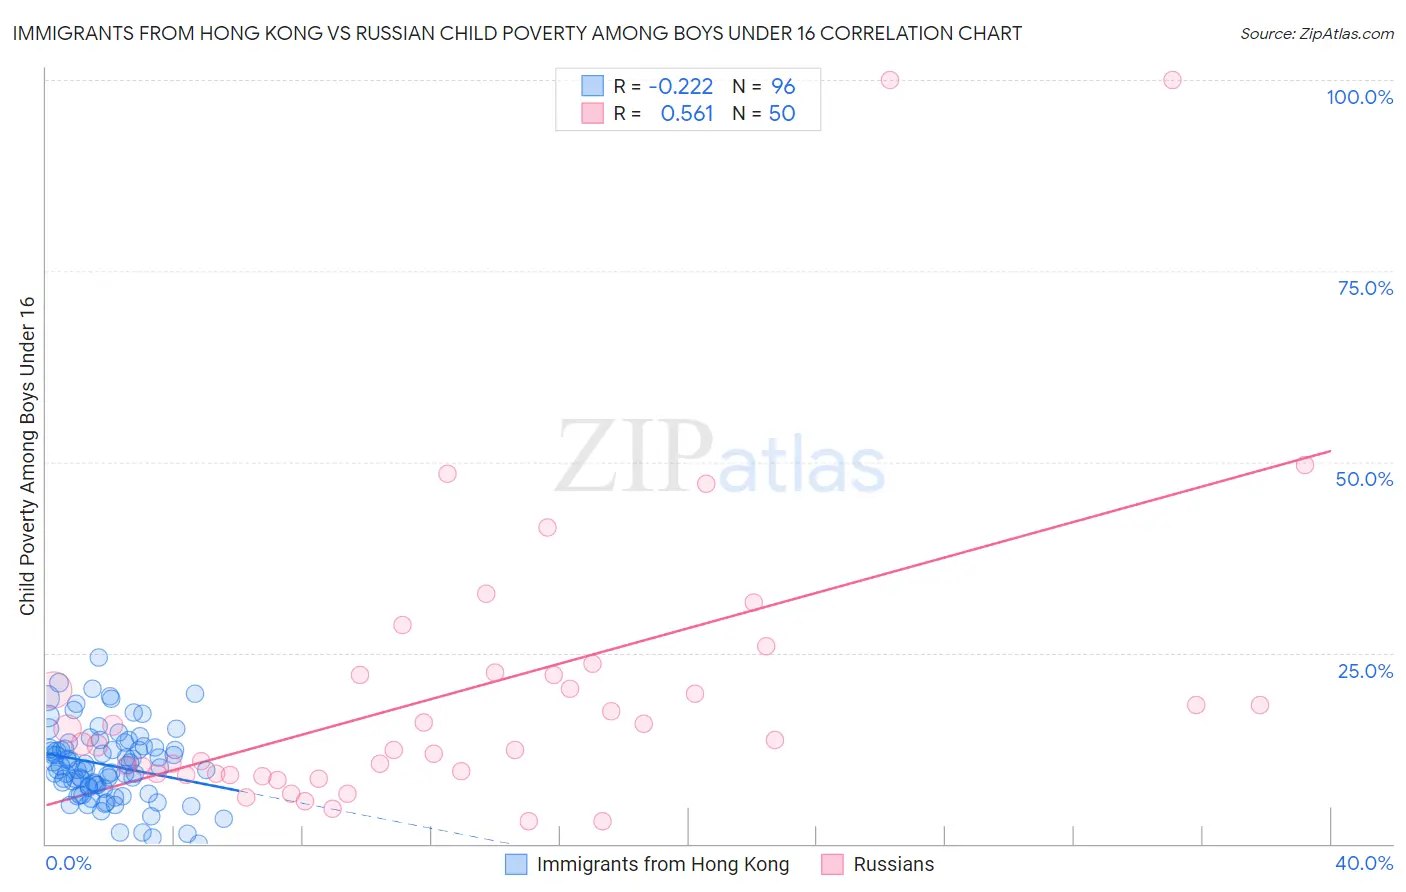
Immigrants from Hong Kong vs Russian Child Poverty Among Boys Under 16 Correlation Chart
The statistical analysis conducted on geographies consisting of 250,620,265 people shows a weak negative correlation between the proportion of Immigrants from Hong Kong and poverty level among boys under the age of 16 in the United States with a correlation coefficient (R) of -0.222 and weighted average of 12.3%. Similarly, the statistical analysis conducted on geographies consisting of 496,789,359 people shows a substantial positive correlation between the proportion of Russians and poverty level among boys under the age of 16 in the United States with a correlation coefficient (R) of 0.561 and weighted average of 13.8%, a difference of 12.4%.
Child Poverty Among Boys Under 16 Correlation Summary
| Measurement | Immigrants from Hong Kong | Russian |
| Minimum | 0.063% | 3.0% |
| Maximum | 24.3% | 100.0% |
| Range | 24.3% | 97.0% |
| Mean | 10.3% | 20.1% |
| Median | 9.9% | 13.4% |
| Interquartile 25% (IQ1) | 7.5% | 9.1% |
| Interquartile 75% (IQ3) | 12.5% | 22.2% |
| Interquartile Range (IQR) | 5.0% | 13.1% |
| Standard Deviation (Sample) | 4.8% | 20.0% |
| Standard Deviation (Population) | 4.7% | 19.8% |
Similar Demographics by Child Poverty Among Boys Under 16
Demographics Similar to Immigrants from Hong Kong by Child Poverty Among Boys Under 16
In terms of child poverty among boys under 16, the demographic groups most similar to Immigrants from Hong Kong are Iranian (12.4%, a difference of 1.6%), Immigrants from Singapore (12.5%, a difference of 1.9%), Immigrants from Iran (12.5%, a difference of 2.4%), Bhutanese (12.6%, a difference of 2.8%), and Chinese (11.9%, a difference of 3.3%).
| Demographics | Rating | Rank | Child Poverty Among Boys Under 16 |
| Immigrants | India | 100.0 /100 | #1 | Exceptional 10.9% |
| Immigrants | Taiwan | 100.0 /100 | #2 | Exceptional 11.0% |
| Filipinos | 100.0 /100 | #3 | Exceptional 11.1% |
| Thais | 100.0 /100 | #4 | Exceptional 11.7% |
| Chinese | 100.0 /100 | #5 | Exceptional 11.9% |
| Immigrants | Hong Kong | 100.0 /100 | #6 | Exceptional 12.3% |
| Iranians | 100.0 /100 | #7 | Exceptional 12.4% |
| Immigrants | Singapore | 100.0 /100 | #8 | Exceptional 12.5% |
| Immigrants | Iran | 100.0 /100 | #9 | Exceptional 12.5% |
| Bhutanese | 100.0 /100 | #10 | Exceptional 12.6% |
| Immigrants | South Central Asia | 100.0 /100 | #11 | Exceptional 12.7% |
| Burmese | 99.9 /100 | #12 | Exceptional 13.0% |
| Immigrants | Korea | 99.9 /100 | #13 | Exceptional 13.0% |
| Immigrants | Ireland | 99.9 /100 | #14 | Exceptional 13.1% |
| Immigrants | Japan | 99.9 /100 | #15 | Exceptional 13.1% |
Demographics Similar to Russians by Child Poverty Among Boys Under 16
In terms of child poverty among boys under 16, the demographic groups most similar to Russians are Luxembourger (13.8%, a difference of 0.27%), Immigrants from Sri Lanka (13.9%, a difference of 0.69%), Immigrants from Northern Europe (13.9%, a difference of 0.83%), Immigrants from Australia (13.9%, a difference of 0.97%), and Assyrian/Chaldean/Syriac (13.6%, a difference of 1.0%).
| Demographics | Rating | Rank | Child Poverty Among Boys Under 16 |
| Eastern Europeans | 99.8 /100 | #28 | Exceptional 13.5% |
| Cypriots | 99.8 /100 | #29 | Exceptional 13.6% |
| Swedes | 99.8 /100 | #30 | Exceptional 13.6% |
| Turks | 99.8 /100 | #31 | Exceptional 13.6% |
| Immigrants | China | 99.8 /100 | #32 | Exceptional 13.6% |
| Danes | 99.8 /100 | #33 | Exceptional 13.6% |
| Assyrians/Chaldeans/Syriacs | 99.8 /100 | #34 | Exceptional 13.6% |
| Russians | 99.7 /100 | #35 | Exceptional 13.8% |
| Luxembourgers | 99.7 /100 | #36 | Exceptional 13.8% |
| Immigrants | Sri Lanka | 99.6 /100 | #37 | Exceptional 13.9% |
| Immigrants | Northern Europe | 99.6 /100 | #38 | Exceptional 13.9% |
| Immigrants | Australia | 99.6 /100 | #39 | Exceptional 13.9% |
| Immigrants | Asia | 99.6 /100 | #40 | Exceptional 13.9% |
| Lithuanians | 99.6 /100 | #41 | Exceptional 14.0% |
| Koreans | 99.6 /100 | #42 | Exceptional 14.0% |