Immigrants from Hong Kong vs Immigrants from Afghanistan Child Poverty Among Boys Under 16
COMPARE
Immigrants from Hong Kong
Immigrants from Afghanistan
Child Poverty Among Boys Under 16
Child Poverty Among Boys Under 16 Comparison
Immigrants from Hong Kong
Immigrants from Afghanistan
12.3%
CHILD POVERTY AMONG BOYS UNDER 16
100.0/ 100
METRIC RATING
6th/ 347
METRIC RANK
17.3%
CHILD POVERTY AMONG BOYS UNDER 16
13.7/ 100
METRIC RATING
201st/ 347
METRIC RANK
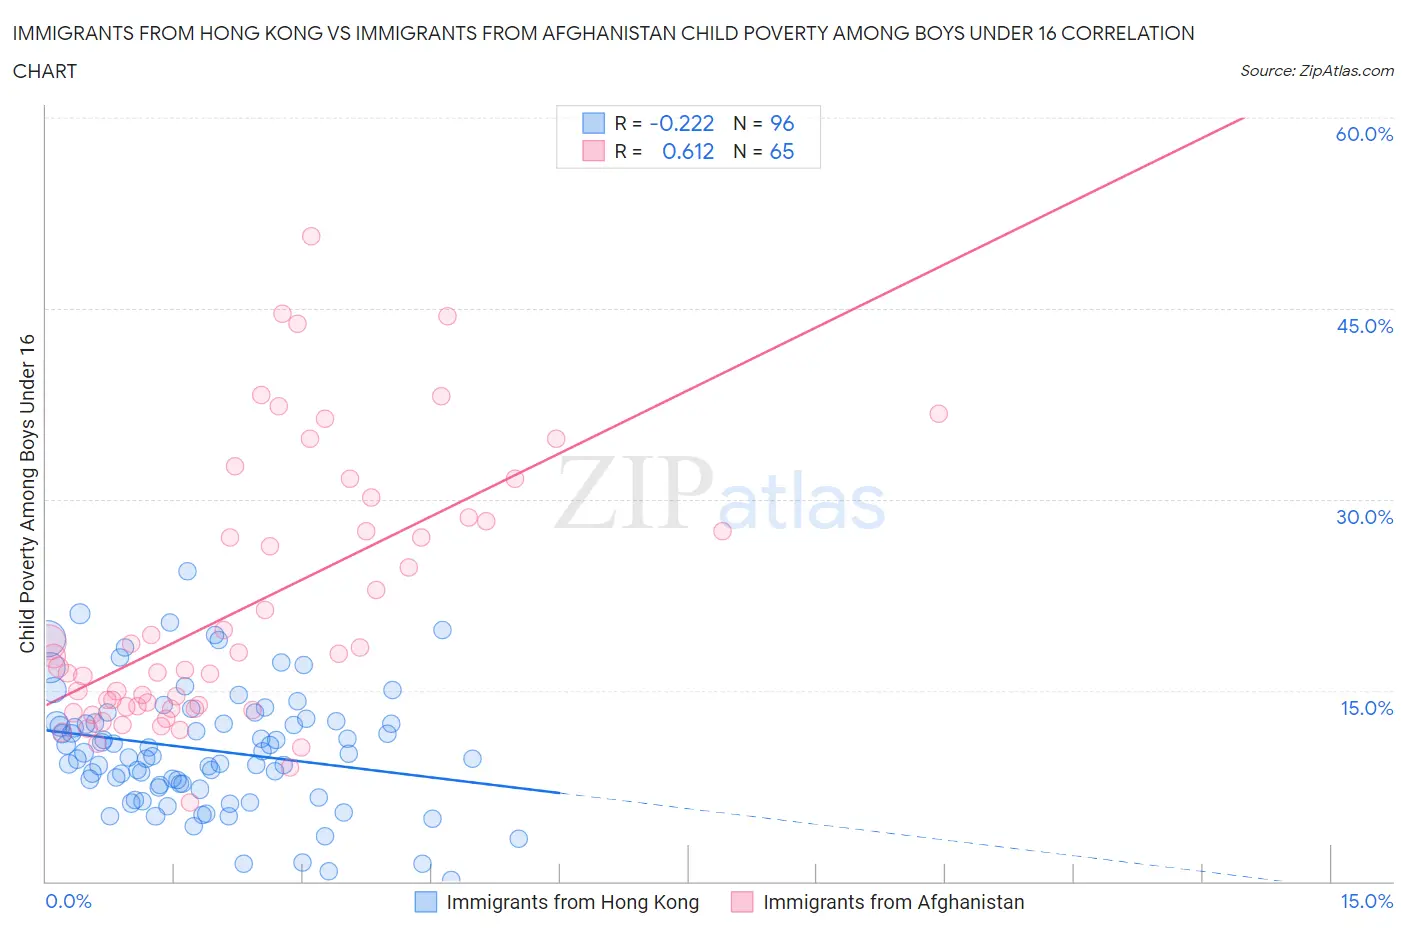
Immigrants from Hong Kong vs Immigrants from Afghanistan Child Poverty Among Boys Under 16 Correlation Chart
The statistical analysis conducted on geographies consisting of 250,620,265 people shows a weak negative correlation between the proportion of Immigrants from Hong Kong and poverty level among boys under the age of 16 in the United States with a correlation coefficient (R) of -0.222 and weighted average of 12.3%. Similarly, the statistical analysis conducted on geographies consisting of 146,910,651 people shows a significant positive correlation between the proportion of Immigrants from Afghanistan and poverty level among boys under the age of 16 in the United States with a correlation coefficient (R) of 0.612 and weighted average of 17.3%, a difference of 41.0%.
Child Poverty Among Boys Under 16 Correlation Summary
| Measurement | Immigrants from Hong Kong | Immigrants from Afghanistan |
| Minimum | 0.063% | 6.2% |
| Maximum | 24.3% | 50.7% |
| Range | 24.3% | 44.5% |
| Mean | 10.3% | 21.6% |
| Median | 9.9% | 17.7% |
| Interquartile 25% (IQ1) | 7.5% | 13.6% |
| Interquartile 75% (IQ3) | 12.5% | 28.4% |
| Interquartile Range (IQR) | 5.0% | 14.8% |
| Standard Deviation (Sample) | 4.8% | 10.5% |
| Standard Deviation (Population) | 4.7% | 10.4% |
Similar Demographics by Child Poverty Among Boys Under 16
Demographics Similar to Immigrants from Hong Kong by Child Poverty Among Boys Under 16
In terms of child poverty among boys under 16, the demographic groups most similar to Immigrants from Hong Kong are Iranian (12.4%, a difference of 1.6%), Immigrants from Singapore (12.5%, a difference of 1.9%), Immigrants from Iran (12.5%, a difference of 2.4%), Bhutanese (12.6%, a difference of 2.8%), and Chinese (11.9%, a difference of 3.3%).
| Demographics | Rating | Rank | Child Poverty Among Boys Under 16 |
| Immigrants | India | 100.0 /100 | #1 | Exceptional 10.9% |
| Immigrants | Taiwan | 100.0 /100 | #2 | Exceptional 11.0% |
| Filipinos | 100.0 /100 | #3 | Exceptional 11.1% |
| Thais | 100.0 /100 | #4 | Exceptional 11.7% |
| Chinese | 100.0 /100 | #5 | Exceptional 11.9% |
| Immigrants | Hong Kong | 100.0 /100 | #6 | Exceptional 12.3% |
| Iranians | 100.0 /100 | #7 | Exceptional 12.4% |
| Immigrants | Singapore | 100.0 /100 | #8 | Exceptional 12.5% |
| Immigrants | Iran | 100.0 /100 | #9 | Exceptional 12.5% |
| Bhutanese | 100.0 /100 | #10 | Exceptional 12.6% |
| Immigrants | South Central Asia | 100.0 /100 | #11 | Exceptional 12.7% |
| Burmese | 99.9 /100 | #12 | Exceptional 13.0% |
| Immigrants | Korea | 99.9 /100 | #13 | Exceptional 13.0% |
| Immigrants | Ireland | 99.9 /100 | #14 | Exceptional 13.1% |
| Immigrants | Japan | 99.9 /100 | #15 | Exceptional 13.1% |
Demographics Similar to Immigrants from Afghanistan by Child Poverty Among Boys Under 16
In terms of child poverty among boys under 16, the demographic groups most similar to Immigrants from Afghanistan are Immigrants from Sierra Leone (17.3%, a difference of 0.060%), Immigrants from Uzbekistan (17.3%, a difference of 0.080%), Ugandan (17.3%, a difference of 0.28%), Immigrants from Portugal (17.4%, a difference of 0.62%), and Immigrants from Uruguay (17.2%, a difference of 0.68%).
| Demographics | Rating | Rank | Child Poverty Among Boys Under 16 |
| Immigrants | Lebanon | 21.2 /100 | #194 | Fair 17.0% |
| Spanish | 20.8 /100 | #195 | Fair 17.0% |
| Spaniards | 20.5 /100 | #196 | Fair 17.1% |
| Immigrants | Kenya | 20.1 /100 | #197 | Fair 17.1% |
| Immigrants | Cameroon | 19.0 /100 | #198 | Poor 17.1% |
| Delaware | 18.8 /100 | #199 | Poor 17.1% |
| Immigrants | Uruguay | 16.9 /100 | #200 | Poor 17.2% |
| Immigrants | Afghanistan | 13.7 /100 | #201 | Poor 17.3% |
| Immigrants | Sierra Leone | 13.4 /100 | #202 | Poor 17.3% |
| Immigrants | Uzbekistan | 13.3 /100 | #203 | Poor 17.3% |
| Ugandans | 12.5 /100 | #204 | Poor 17.3% |
| Immigrants | Portugal | 11.2 /100 | #205 | Poor 17.4% |
| German Russians | 10.9 /100 | #206 | Poor 17.4% |
| Immigrants | Thailand | 8.2 /100 | #207 | Tragic 17.5% |
| Malaysians | 7.6 /100 | #208 | Tragic 17.6% |