Immigrants from Hong Kong vs Immigrants from Egypt Seniors Poverty Over the Age of 65
COMPARE
Immigrants from Hong Kong
Immigrants from Egypt
Seniors Poverty Over the Age of 65
Seniors Poverty Over the Age of 65 Comparison
Immigrants from Hong Kong
Immigrants from Egypt
11.1%
SENIORS POVERTY OVER THE AGE OF 65
36.3/ 100
METRIC RATING
188th/ 347
METRIC RANK
10.6%
SENIORS POVERTY OVER THE AGE OF 65
76.5/ 100
METRIC RATING
152nd/ 347
METRIC RANK
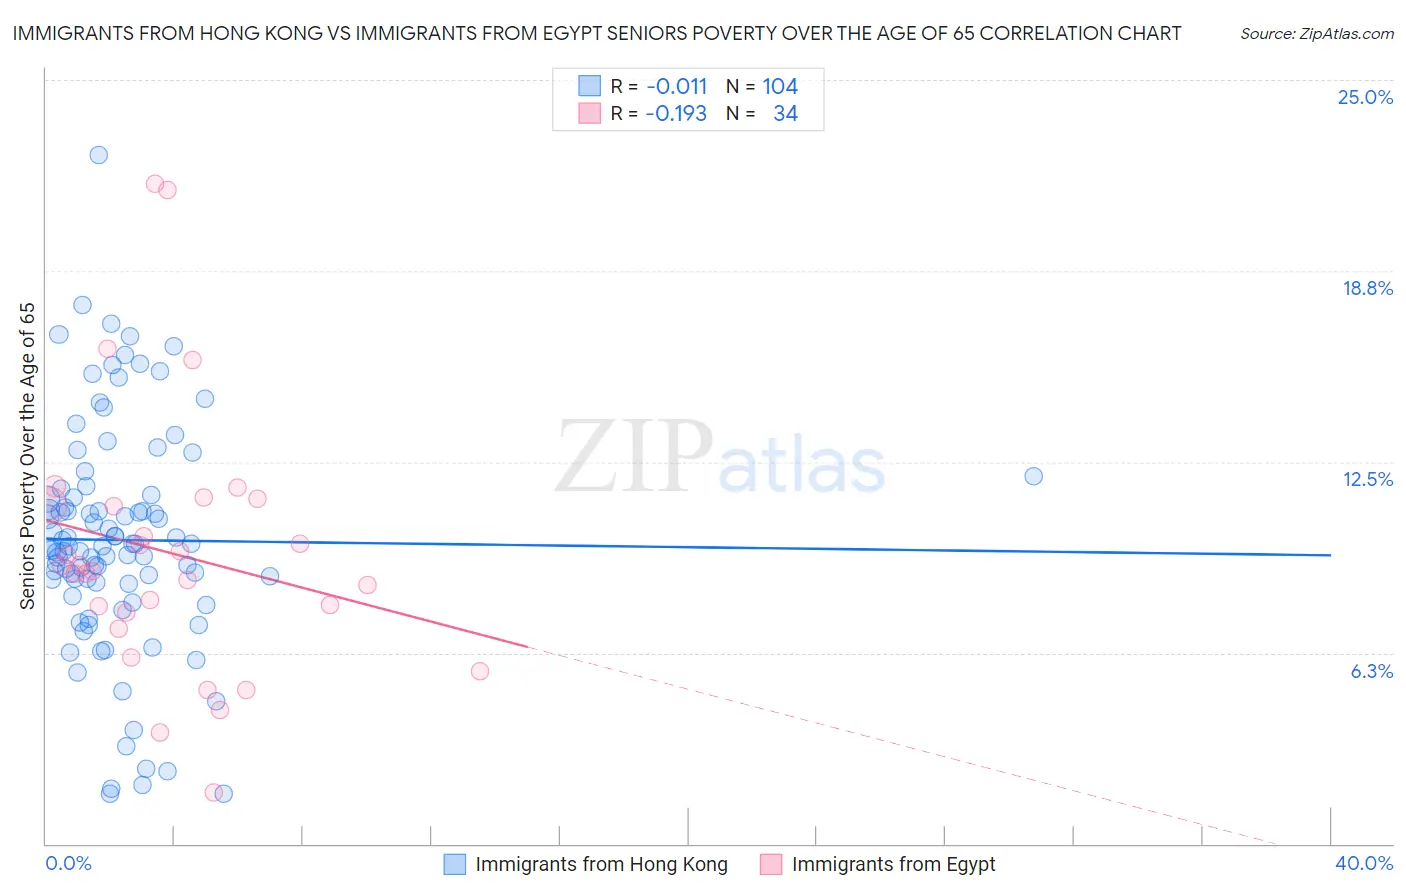
Immigrants from Hong Kong vs Immigrants from Egypt Seniors Poverty Over the Age of 65 Correlation Chart
The statistical analysis conducted on geographies consisting of 253,445,641 people shows no correlation between the proportion of Immigrants from Hong Kong and poverty level among seniors over the age of 65 in the United States with a correlation coefficient (R) of -0.011 and weighted average of 11.1%. Similarly, the statistical analysis conducted on geographies consisting of 245,049,036 people shows a poor negative correlation between the proportion of Immigrants from Egypt and poverty level among seniors over the age of 65 in the United States with a correlation coefficient (R) of -0.193 and weighted average of 10.6%, a difference of 4.0%.
Seniors Poverty Over the Age of 65 Correlation Summary
| Measurement | Immigrants from Hong Kong | Immigrants from Egypt |
| Minimum | 1.6% | 1.7% |
| Maximum | 22.5% | 21.6% |
| Range | 20.9% | 19.9% |
| Mean | 9.9% | 9.5% |
| Median | 9.7% | 9.0% |
| Interquartile 25% (IQ1) | 8.5% | 7.6% |
| Interquartile 75% (IQ3) | 11.4% | 11.1% |
| Interquartile Range (IQR) | 2.9% | 3.5% |
| Standard Deviation (Sample) | 3.7% | 4.3% |
| Standard Deviation (Population) | 3.7% | 4.2% |
Similar Demographics by Seniors Poverty Over the Age of 65
Demographics Similar to Immigrants from Hong Kong by Seniors Poverty Over the Age of 65
In terms of seniors poverty over the age of 65, the demographic groups most similar to Immigrants from Hong Kong are Immigrants from Laos (11.1%, a difference of 0.060%), Immigrants from Middle Africa (11.1%, a difference of 0.10%), Immigrants from Eastern Asia (11.1%, a difference of 0.11%), Immigrants from Lebanon (11.1%, a difference of 0.17%), and Indian (Asian) (11.1%, a difference of 0.21%).
| Demographics | Rating | Rank | Seniors Poverty Over the Age of 65 |
| Immigrants | Eastern Africa | 43.4 /100 | #181 | Average 11.0% |
| Immigrants | Fiji | 42.0 /100 | #182 | Average 11.0% |
| Immigrants | Kazakhstan | 41.0 /100 | #183 | Average 11.0% |
| Immigrants | France | 40.9 /100 | #184 | Average 11.0% |
| Immigrants | Lebanon | 38.2 /100 | #185 | Fair 11.1% |
| Immigrants | Eastern Asia | 37.5 /100 | #186 | Fair 11.1% |
| Immigrants | Middle Africa | 37.4 /100 | #187 | Fair 11.1% |
| Immigrants | Hong Kong | 36.3 /100 | #188 | Fair 11.1% |
| Immigrants | Laos | 35.7 /100 | #189 | Fair 11.1% |
| Indians (Asian) | 34.2 /100 | #190 | Fair 11.1% |
| Immigrants | Uganda | 32.2 /100 | #191 | Fair 11.1% |
| Immigrants | Southern Europe | 30.1 /100 | #192 | Fair 11.1% |
| Taiwanese | 29.2 /100 | #193 | Fair 11.2% |
| Chileans | 27.8 /100 | #194 | Fair 11.2% |
| Immigrants | Vietnam | 26.6 /100 | #195 | Fair 11.2% |
Demographics Similar to Immigrants from Egypt by Seniors Poverty Over the Age of 65
In terms of seniors poverty over the age of 65, the demographic groups most similar to Immigrants from Egypt are Spanish (10.6%, a difference of 0.040%), Immigrants from Switzerland (10.6%, a difference of 0.10%), Fijian (10.7%, a difference of 0.11%), Immigrants from Saudi Arabia (10.7%, a difference of 0.19%), and American (10.6%, a difference of 0.21%).
| Demographics | Rating | Rank | Seniors Poverty Over the Age of 65 |
| Laotians | 79.9 /100 | #145 | Good 10.6% |
| Alaskan Athabascans | 79.1 /100 | #146 | Good 10.6% |
| Immigrants | Greece | 79.0 /100 | #147 | Good 10.6% |
| Americans | 78.1 /100 | #148 | Good 10.6% |
| Immigrants | Cameroon | 78.1 /100 | #149 | Good 10.6% |
| Immigrants | Switzerland | 77.3 /100 | #150 | Good 10.6% |
| Spanish | 76.8 /100 | #151 | Good 10.6% |
| Immigrants | Egypt | 76.5 /100 | #152 | Good 10.6% |
| Fijians | 75.6 /100 | #153 | Good 10.7% |
| Immigrants | Saudi Arabia | 74.9 /100 | #154 | Good 10.7% |
| Chickasaw | 73.6 /100 | #155 | Good 10.7% |
| Ethiopians | 72.9 /100 | #156 | Good 10.7% |
| Immigrants | Ethiopia | 72.9 /100 | #157 | Good 10.7% |
| Immigrants | Sierra Leone | 71.7 /100 | #158 | Good 10.7% |
| Immigrants | Micronesia | 70.8 /100 | #159 | Good 10.7% |