U.S. Virgin Islander vs Immigrants from Egypt Seniors Poverty Over the Age of 65
COMPARE
U.S. Virgin Islander
Immigrants from Egypt
Seniors Poverty Over the Age of 65
Seniors Poverty Over the Age of 65 Comparison
U.S. Virgin Islanders
Immigrants from Egypt
14.0%
SENIORS POVERTY OVER THE AGE OF 65
0.0/ 100
METRIC RATING
301st/ 347
METRIC RANK
10.6%
SENIORS POVERTY OVER THE AGE OF 65
76.5/ 100
METRIC RATING
152nd/ 347
METRIC RANK
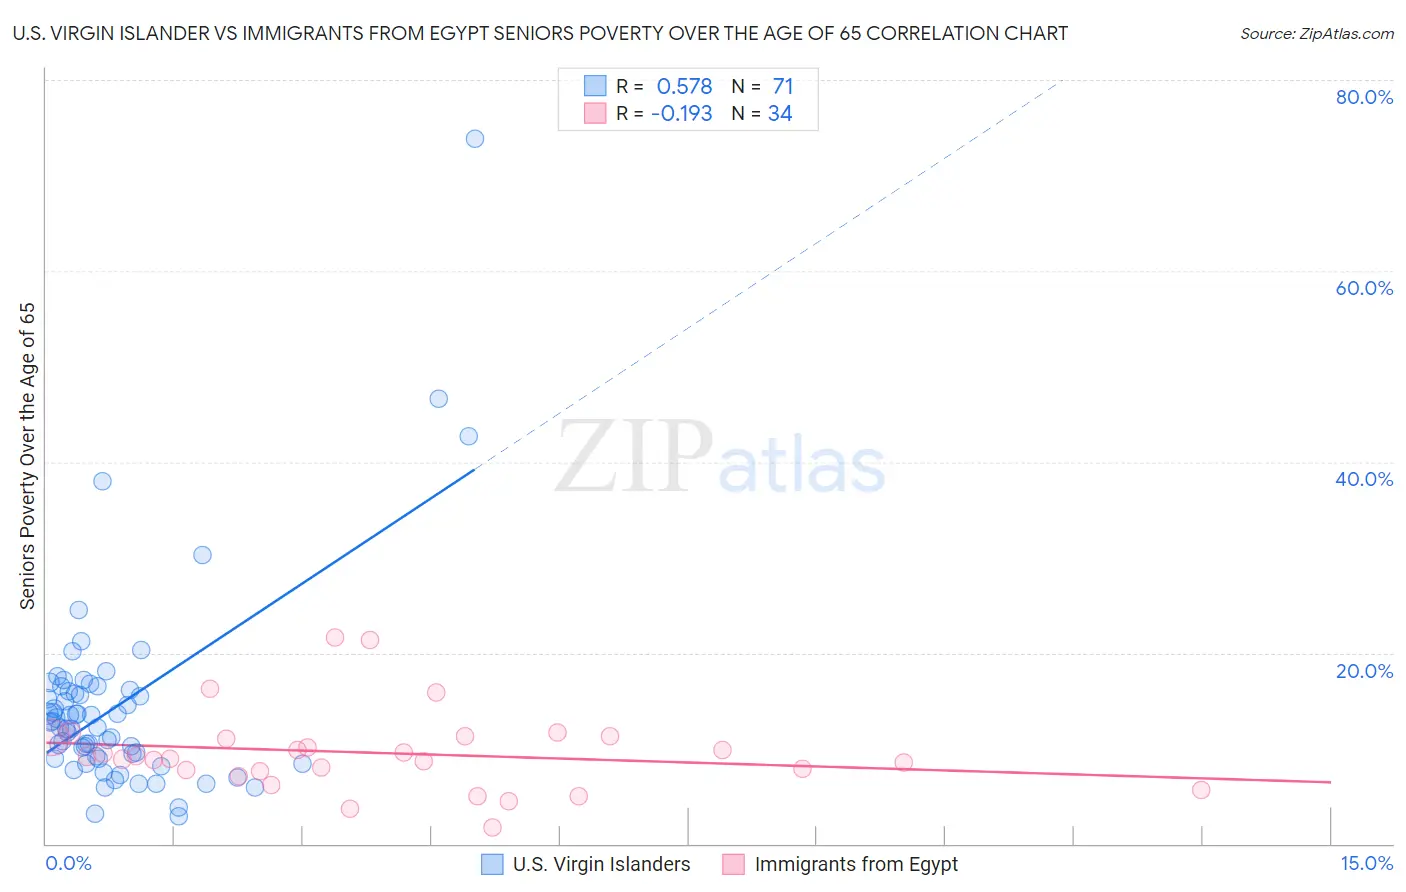
U.S. Virgin Islander vs Immigrants from Egypt Seniors Poverty Over the Age of 65 Correlation Chart
The statistical analysis conducted on geographies consisting of 87,442,281 people shows a substantial positive correlation between the proportion of U.S. Virgin Islanders and poverty level among seniors over the age of 65 in the United States with a correlation coefficient (R) of 0.578 and weighted average of 14.0%. Similarly, the statistical analysis conducted on geographies consisting of 245,049,036 people shows a poor negative correlation between the proportion of Immigrants from Egypt and poverty level among seniors over the age of 65 in the United States with a correlation coefficient (R) of -0.193 and weighted average of 10.6%, a difference of 31.9%.
Seniors Poverty Over the Age of 65 Correlation Summary
| Measurement | U.S. Virgin Islander | Immigrants from Egypt |
| Minimum | 2.9% | 1.7% |
| Maximum | 73.8% | 21.6% |
| Range | 70.9% | 19.9% |
| Mean | 14.5% | 9.5% |
| Median | 12.7% | 9.0% |
| Interquartile 25% (IQ1) | 8.9% | 7.6% |
| Interquartile 75% (IQ3) | 16.1% | 11.1% |
| Interquartile Range (IQR) | 7.2% | 3.5% |
| Standard Deviation (Sample) | 10.6% | 4.3% |
| Standard Deviation (Population) | 10.5% | 4.2% |
Similar Demographics by Seniors Poverty Over the Age of 65
Demographics Similar to U.S. Virgin Islanders by Seniors Poverty Over the Age of 65
In terms of seniors poverty over the age of 65, the demographic groups most similar to U.S. Virgin Islanders are Yup'ik (14.1%, a difference of 0.080%), Immigrants from Bangladesh (14.1%, a difference of 0.19%), Immigrants from Uzbekistan (14.0%, a difference of 0.21%), Ecuadorian (14.0%, a difference of 0.28%), and Immigrants from Belize (14.0%, a difference of 0.36%).
| Demographics | Rating | Rank | Seniors Poverty Over the Age of 65 |
| Cheyenne | 0.0 /100 | #294 | Tragic 13.9% |
| Apache | 0.0 /100 | #295 | Tragic 13.9% |
| Immigrants | Jamaica | 0.0 /100 | #296 | Tragic 13.9% |
| Vietnamese | 0.0 /100 | #297 | Tragic 14.0% |
| Immigrants | Belize | 0.0 /100 | #298 | Tragic 14.0% |
| Ecuadorians | 0.0 /100 | #299 | Tragic 14.0% |
| Immigrants | Uzbekistan | 0.0 /100 | #300 | Tragic 14.0% |
| U.S. Virgin Islanders | 0.0 /100 | #301 | Tragic 14.0% |
| Yup'ik | 0.0 /100 | #302 | Tragic 14.1% |
| Immigrants | Bangladesh | 0.0 /100 | #303 | Tragic 14.1% |
| West Indians | 0.0 /100 | #304 | Tragic 14.1% |
| Immigrants | Trinidad and Tobago | 0.0 /100 | #305 | Tragic 14.1% |
| Immigrants | Latin America | 0.0 /100 | #306 | Tragic 14.2% |
| Immigrants | West Indies | 0.0 /100 | #307 | Tragic 14.2% |
| Trinidadians and Tobagonians | 0.0 /100 | #308 | Tragic 14.2% |
Demographics Similar to Immigrants from Egypt by Seniors Poverty Over the Age of 65
In terms of seniors poverty over the age of 65, the demographic groups most similar to Immigrants from Egypt are Spanish (10.6%, a difference of 0.040%), Immigrants from Switzerland (10.6%, a difference of 0.10%), Fijian (10.7%, a difference of 0.11%), Immigrants from Saudi Arabia (10.7%, a difference of 0.19%), and American (10.6%, a difference of 0.21%).
| Demographics | Rating | Rank | Seniors Poverty Over the Age of 65 |
| Laotians | 79.9 /100 | #145 | Good 10.6% |
| Alaskan Athabascans | 79.1 /100 | #146 | Good 10.6% |
| Immigrants | Greece | 79.0 /100 | #147 | Good 10.6% |
| Americans | 78.1 /100 | #148 | Good 10.6% |
| Immigrants | Cameroon | 78.1 /100 | #149 | Good 10.6% |
| Immigrants | Switzerland | 77.3 /100 | #150 | Good 10.6% |
| Spanish | 76.8 /100 | #151 | Good 10.6% |
| Immigrants | Egypt | 76.5 /100 | #152 | Good 10.6% |
| Fijians | 75.6 /100 | #153 | Good 10.7% |
| Immigrants | Saudi Arabia | 74.9 /100 | #154 | Good 10.7% |
| Chickasaw | 73.6 /100 | #155 | Good 10.7% |
| Ethiopians | 72.9 /100 | #156 | Good 10.7% |
| Immigrants | Ethiopia | 72.9 /100 | #157 | Good 10.7% |
| Immigrants | Sierra Leone | 71.7 /100 | #158 | Good 10.7% |
| Immigrants | Micronesia | 70.8 /100 | #159 | Good 10.7% |