Immigrants from Haiti vs Immigrants from Belgium Child Poverty Among Boys Under 16
COMPARE
Immigrants from Haiti
Immigrants from Belgium
Child Poverty Among Boys Under 16
Child Poverty Among Boys Under 16 Comparison
Immigrants from Haiti
Immigrants from Belgium
21.3%
CHILD POVERTY AMONG BOYS UNDER 16
0.0/ 100
METRIC RATING
303rd/ 347
METRIC RANK
14.4%
CHILD POVERTY AMONG BOYS UNDER 16
98.9/ 100
METRIC RATING
60th/ 347
METRIC RANK
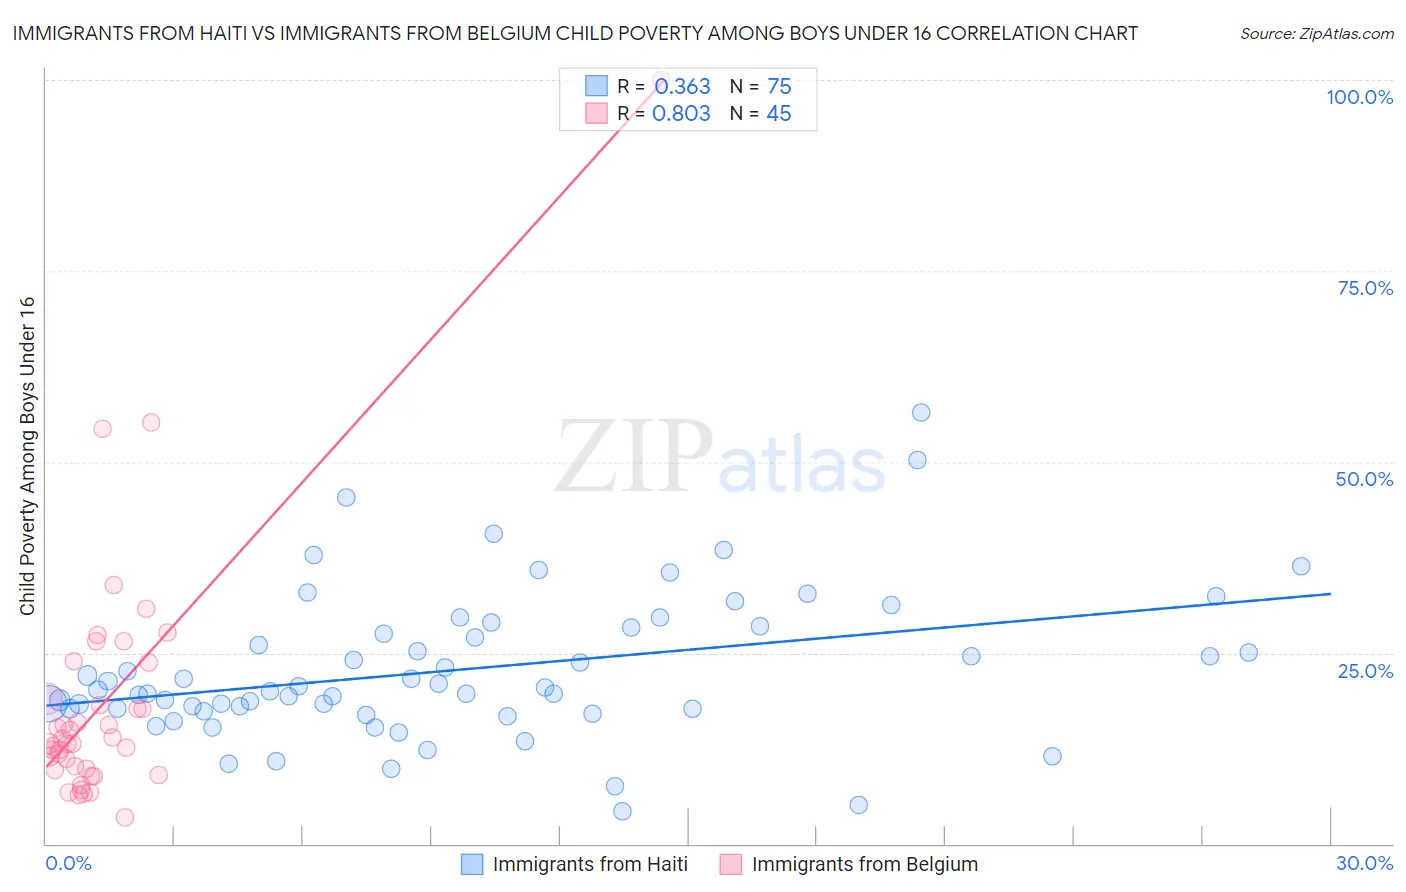
Immigrants from Haiti vs Immigrants from Belgium Child Poverty Among Boys Under 16 Correlation Chart
The statistical analysis conducted on geographies consisting of 222,982,016 people shows a mild positive correlation between the proportion of Immigrants from Haiti and poverty level among boys under the age of 16 in the United States with a correlation coefficient (R) of 0.363 and weighted average of 21.3%. Similarly, the statistical analysis conducted on geographies consisting of 145,199,128 people shows a very strong positive correlation between the proportion of Immigrants from Belgium and poverty level among boys under the age of 16 in the United States with a correlation coefficient (R) of 0.803 and weighted average of 14.4%, a difference of 47.9%.
Child Poverty Among Boys Under 16 Correlation Summary
| Measurement | Immigrants from Haiti | Immigrants from Belgium |
| Minimum | 4.2% | 3.5% |
| Maximum | 56.4% | 100.0% |
| Range | 52.2% | 96.5% |
| Mean | 22.8% | 18.5% |
| Median | 20.2% | 13.1% |
| Interquartile 25% (IQ1) | 17.6% | 9.8% |
| Interquartile 75% (IQ3) | 28.3% | 21.3% |
| Interquartile Range (IQR) | 10.7% | 11.6% |
| Standard Deviation (Sample) | 9.6% | 16.5% |
| Standard Deviation (Population) | 9.6% | 16.3% |
Similar Demographics by Child Poverty Among Boys Under 16
Demographics Similar to Immigrants from Haiti by Child Poverty Among Boys Under 16
In terms of child poverty among boys under 16, the demographic groups most similar to Immigrants from Haiti are Immigrants from Central America (21.3%, a difference of 0.060%), Kiowa (21.3%, a difference of 0.23%), Immigrants from Grenada (21.3%, a difference of 0.24%), Choctaw (21.3%, a difference of 0.33%), and Guatemalan (21.1%, a difference of 0.54%).
| Demographics | Rating | Rank | Child Poverty Among Boys Under 16 |
| Indonesians | 0.0 /100 | #296 | Tragic 20.8% |
| Hispanics or Latinos | 0.0 /100 | #297 | Tragic 20.9% |
| Chippewa | 0.0 /100 | #298 | Tragic 21.0% |
| Immigrants | Caribbean | 0.0 /100 | #299 | Tragic 21.0% |
| Haitians | 0.0 /100 | #300 | Tragic 21.0% |
| Guatemalans | 0.0 /100 | #301 | Tragic 21.1% |
| Somalis | 0.0 /100 | #302 | Tragic 21.1% |
| Immigrants | Haiti | 0.0 /100 | #303 | Tragic 21.3% |
| Immigrants | Central America | 0.0 /100 | #304 | Tragic 21.3% |
| Kiowa | 0.0 /100 | #305 | Tragic 21.3% |
| Immigrants | Grenada | 0.0 /100 | #306 | Tragic 21.3% |
| Choctaw | 0.0 /100 | #307 | Tragic 21.3% |
| Immigrants | Mexico | 0.0 /100 | #308 | Tragic 21.5% |
| Seminole | 0.0 /100 | #309 | Tragic 21.5% |
| Creek | 0.0 /100 | #310 | Tragic 21.5% |
Demographics Similar to Immigrants from Belgium by Child Poverty Among Boys Under 16
In terms of child poverty among boys under 16, the demographic groups most similar to Immigrants from Belgium are Immigrants from Czechoslovakia (14.4%, a difference of 0.020%), Immigrants from Sweden (14.4%, a difference of 0.040%), Polish (14.4%, a difference of 0.12%), Scandinavian (14.4%, a difference of 0.12%), and Zimbabwean (14.3%, a difference of 0.22%).
| Demographics | Rating | Rank | Child Poverty Among Boys Under 16 |
| Immigrants | Philippines | 99.0 /100 | #53 | Exceptional 14.3% |
| Immigrants | Serbia | 99.0 /100 | #54 | Exceptional 14.3% |
| Immigrants | Pakistan | 99.0 /100 | #55 | Exceptional 14.3% |
| Zimbabweans | 99.0 /100 | #56 | Exceptional 14.3% |
| Poles | 98.9 /100 | #57 | Exceptional 14.4% |
| Immigrants | Sweden | 98.9 /100 | #58 | Exceptional 14.4% |
| Immigrants | Czechoslovakia | 98.9 /100 | #59 | Exceptional 14.4% |
| Immigrants | Belgium | 98.9 /100 | #60 | Exceptional 14.4% |
| Scandinavians | 98.8 /100 | #61 | Exceptional 14.4% |
| Immigrants | Israel | 98.7 /100 | #62 | Exceptional 14.4% |
| Cambodians | 98.5 /100 | #63 | Exceptional 14.5% |
| Immigrants | Romania | 98.5 /100 | #64 | Exceptional 14.5% |
| Soviet Union | 98.5 /100 | #65 | Exceptional 14.5% |
| Immigrants | Bulgaria | 98.5 /100 | #66 | Exceptional 14.5% |
| Immigrants | Europe | 98.4 /100 | #67 | Exceptional 14.5% |