Immigrants from Haiti vs Immigrants from Belarus Child Poverty Among Girls Under 16
COMPARE
Immigrants from Haiti
Immigrants from Belarus
Child Poverty Among Girls Under 16
Child Poverty Among Girls Under 16 Comparison
Immigrants from Haiti
Immigrants from Belarus
20.6%
CHILD POVERTY AMONG GIRLS UNDER 16
0.0/ 100
METRIC RATING
290th/ 347
METRIC RANK
14.8%
CHILD POVERTY AMONG GIRLS UNDER 16
97.0/ 100
METRIC RATING
91st/ 347
METRIC RANK
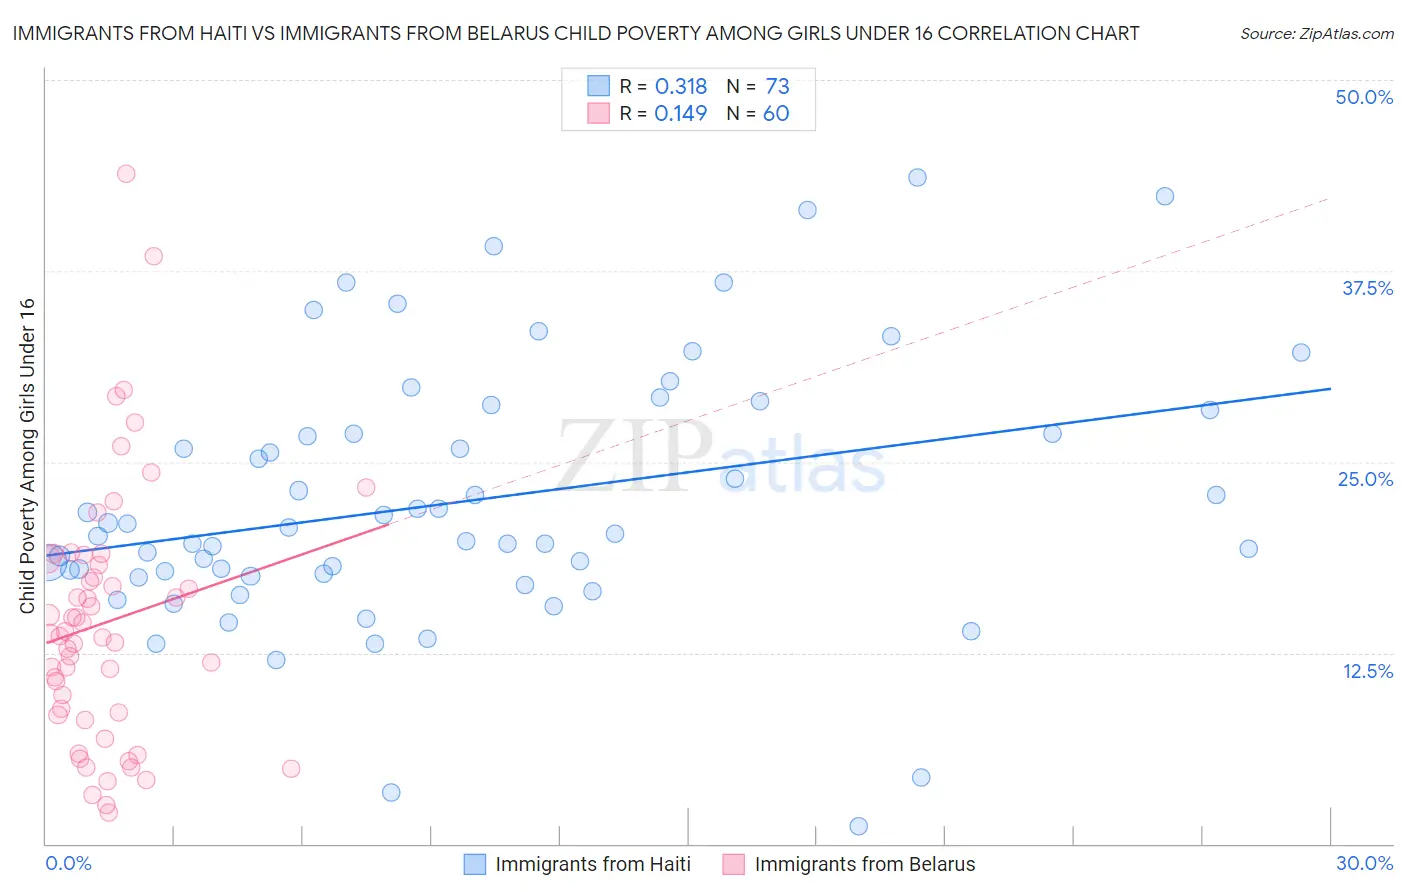
Immigrants from Haiti vs Immigrants from Belarus Child Poverty Among Girls Under 16 Correlation Chart
The statistical analysis conducted on geographies consisting of 222,631,000 people shows a mild positive correlation between the proportion of Immigrants from Haiti and poverty level among girls under the age of 16 in the United States with a correlation coefficient (R) of 0.318 and weighted average of 20.6%. Similarly, the statistical analysis conducted on geographies consisting of 148,734,264 people shows a poor positive correlation between the proportion of Immigrants from Belarus and poverty level among girls under the age of 16 in the United States with a correlation coefficient (R) of 0.149 and weighted average of 14.8%, a difference of 39.0%.
Child Poverty Among Girls Under 16 Correlation Summary
| Measurement | Immigrants from Haiti | Immigrants from Belarus |
| Minimum | 1.1% | 2.0% |
| Maximum | 43.6% | 43.9% |
| Range | 42.5% | 41.9% |
| Mean | 22.4% | 14.5% |
| Median | 20.3% | 13.7% |
| Interquartile 25% (IQ1) | 17.6% | 8.5% |
| Interquartile 75% (IQ3) | 27.6% | 18.5% |
| Interquartile Range (IQR) | 10.0% | 9.9% |
| Standard Deviation (Sample) | 8.6% | 8.4% |
| Standard Deviation (Population) | 8.5% | 8.3% |
Similar Demographics by Child Poverty Among Girls Under 16
Demographics Similar to Immigrants from Haiti by Child Poverty Among Girls Under 16
In terms of child poverty among girls under 16, the demographic groups most similar to Immigrants from Haiti are Immigrants from Belize (20.6%, a difference of 0.070%), Chippewa (20.6%, a difference of 0.13%), Immigrants from Latin America (20.6%, a difference of 0.20%), Immigrants from Grenada (20.7%, a difference of 0.24%), and Immigrants from Senegal (20.7%, a difference of 0.35%).
| Demographics | Rating | Rank | Child Poverty Among Girls Under 16 |
| Senegalese | 0.0 /100 | #283 | Tragic 20.3% |
| Yaqui | 0.0 /100 | #284 | Tragic 20.3% |
| Immigrants | Cabo Verde | 0.0 /100 | #285 | Tragic 20.3% |
| Iroquois | 0.0 /100 | #286 | Tragic 20.4% |
| Blackfeet | 0.0 /100 | #287 | Tragic 20.5% |
| Haitians | 0.0 /100 | #288 | Tragic 20.5% |
| Immigrants | Belize | 0.0 /100 | #289 | Tragic 20.6% |
| Immigrants | Haiti | 0.0 /100 | #290 | Tragic 20.6% |
| Chippewa | 0.0 /100 | #291 | Tragic 20.6% |
| Immigrants | Latin America | 0.0 /100 | #292 | Tragic 20.6% |
| Immigrants | Grenada | 0.0 /100 | #293 | Tragic 20.7% |
| Immigrants | Senegal | 0.0 /100 | #294 | Tragic 20.7% |
| Immigrants | Caribbean | 0.0 /100 | #295 | Tragic 20.7% |
| Immigrants | West Indies | 0.0 /100 | #296 | Tragic 20.7% |
| Inupiat | 0.0 /100 | #297 | Tragic 20.8% |
Demographics Similar to Immigrants from Belarus by Child Poverty Among Girls Under 16
In terms of child poverty among girls under 16, the demographic groups most similar to Immigrants from Belarus are Northern European (14.8%, a difference of 0.040%), Jordanian (14.8%, a difference of 0.060%), Immigrants from Canada (14.8%, a difference of 0.11%), Finnish (14.8%, a difference of 0.18%), and Australian (14.8%, a difference of 0.20%).
| Demographics | Rating | Rank | Child Poverty Among Girls Under 16 |
| Soviet Union | 97.3 /100 | #84 | Exceptional 14.8% |
| Swiss | 97.2 /100 | #85 | Exceptional 14.8% |
| Australians | 97.2 /100 | #86 | Exceptional 14.8% |
| Finns | 97.2 /100 | #87 | Exceptional 14.8% |
| Immigrants | Canada | 97.1 /100 | #88 | Exceptional 14.8% |
| Jordanians | 97.1 /100 | #89 | Exceptional 14.8% |
| Northern Europeans | 97.0 /100 | #90 | Exceptional 14.8% |
| Immigrants | Belarus | 97.0 /100 | #91 | Exceptional 14.8% |
| Austrians | 96.7 /100 | #92 | Exceptional 14.9% |
| Immigrants | North America | 96.6 /100 | #93 | Exceptional 14.9% |
| Immigrants | Switzerland | 96.3 /100 | #94 | Exceptional 14.9% |
| Germans | 96.3 /100 | #95 | Exceptional 14.9% |
| Immigrants | France | 96.2 /100 | #96 | Exceptional 14.9% |
| Immigrants | Latvia | 96.1 /100 | #97 | Exceptional 14.9% |
| Basques | 95.9 /100 | #98 | Exceptional 15.0% |