Immigrants from Haiti vs Immigrants from Belarus Householder Income Under 25 years
COMPARE
Immigrants from Haiti
Immigrants from Belarus
Householder Income Under 25 years
Householder Income Under 25 years Comparison
Immigrants from Haiti
Immigrants from Belarus
$50,398
HOUSEHOLDER INCOME UNDER 25 YEARS
1.2/ 100
METRIC RATING
253rd/ 347
METRIC RANK
$55,743
HOUSEHOLDER INCOME UNDER 25 YEARS
100.0/ 100
METRIC RATING
39th/ 347
METRIC RANK
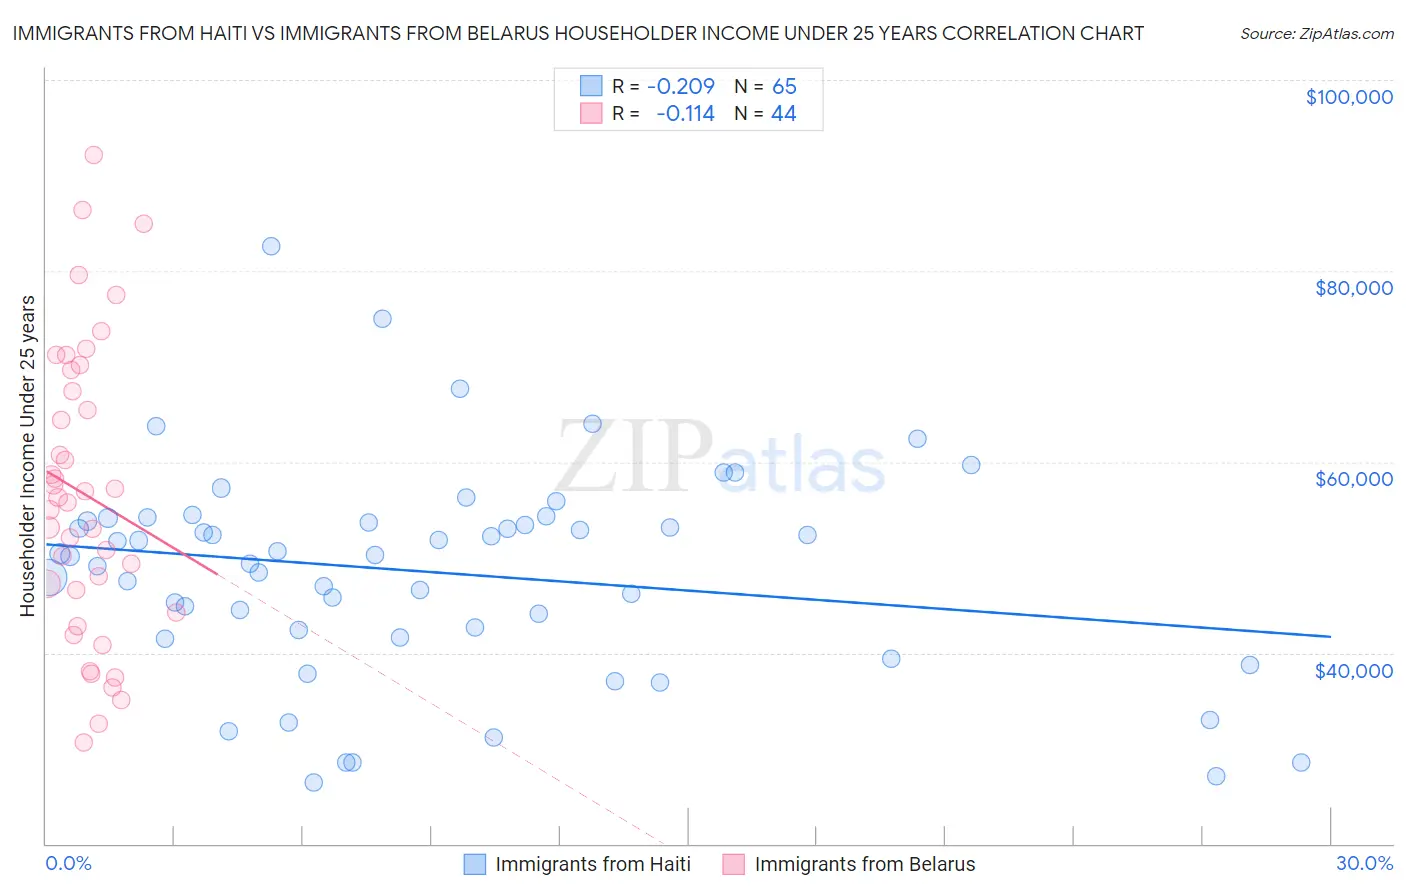
Immigrants from Haiti vs Immigrants from Belarus Householder Income Under 25 years Correlation Chart
The statistical analysis conducted on geographies consisting of 194,658,893 people shows a weak negative correlation between the proportion of Immigrants from Haiti and household income with householder under the age of 25 in the United States with a correlation coefficient (R) of -0.209 and weighted average of $50,398. Similarly, the statistical analysis conducted on geographies consisting of 133,690,397 people shows a poor negative correlation between the proportion of Immigrants from Belarus and household income with householder under the age of 25 in the United States with a correlation coefficient (R) of -0.114 and weighted average of $55,743, a difference of 10.6%.
Householder Income Under 25 years Correlation Summary
| Measurement | Immigrants from Haiti | Immigrants from Belarus |
| Minimum | $26,470 | $30,579 |
| Maximum | $82,635 | $92,155 |
| Range | $56,166 | $61,576 |
| Mean | $48,468 | $56,592 |
| Median | $50,234 | $56,002 |
| Interquartile 25% (IQ1) | $41,992 | $45,431 |
| Interquartile 75% (IQ3) | $53,925 | $68,480 |
| Interquartile Range (IQR) | $11,932 | $23,049 |
| Standard Deviation (Sample) | $11,076 | $15,215 |
| Standard Deviation (Population) | $10,991 | $15,041 |
Similar Demographics by Householder Income Under 25 years
Demographics Similar to Immigrants from Haiti by Householder Income Under 25 years
In terms of householder income under 25 years, the demographic groups most similar to Immigrants from Haiti are Luxembourger ($50,379, a difference of 0.040%), Aleut ($50,377, a difference of 0.040%), Immigrants from Mexico ($50,422, a difference of 0.050%), Immigrants from Cuba ($50,374, a difference of 0.050%), and Lebanese ($50,355, a difference of 0.090%).
| Demographics | Rating | Rank | Householder Income Under 25 years |
| Welsh | 2.0 /100 | #246 | Tragic $50,597 |
| Immigrants | Bosnia and Herzegovina | 1.8 /100 | #247 | Tragic $50,565 |
| Slavs | 1.8 /100 | #248 | Tragic $50,563 |
| Scottish | 1.8 /100 | #249 | Tragic $50,554 |
| Immigrants | Cabo Verde | 1.7 /100 | #250 | Tragic $50,520 |
| Celtics | 1.4 /100 | #251 | Tragic $50,447 |
| Immigrants | Mexico | 1.3 /100 | #252 | Tragic $50,422 |
| Immigrants | Haiti | 1.2 /100 | #253 | Tragic $50,398 |
| Luxembourgers | 1.2 /100 | #254 | Tragic $50,379 |
| Aleuts | 1.2 /100 | #255 | Tragic $50,377 |
| Immigrants | Cuba | 1.2 /100 | #256 | Tragic $50,374 |
| Lebanese | 1.1 /100 | #257 | Tragic $50,355 |
| Whites/Caucasians | 1.1 /100 | #258 | Tragic $50,336 |
| Immigrants | Dominica | 1.0 /100 | #259 | Tragic $50,301 |
| Hispanics or Latinos | 0.9 /100 | #260 | Tragic $50,279 |
Demographics Similar to Immigrants from Belarus by Householder Income Under 25 years
In terms of householder income under 25 years, the demographic groups most similar to Immigrants from Belarus are Immigrants from Greece ($55,727, a difference of 0.030%), Immigrants from Guyana ($55,726, a difference of 0.030%), Immigrants from Korea ($55,716, a difference of 0.050%), Immigrants from South Eastern Asia ($55,714, a difference of 0.050%), and Paraguayan ($55,614, a difference of 0.23%).
| Demographics | Rating | Rank | Householder Income Under 25 years |
| Peruvians | 100.0 /100 | #32 | Exceptional $56,052 |
| Inupiat | 100.0 /100 | #33 | Exceptional $55,935 |
| Immigrants | Japan | 100.0 /100 | #34 | Exceptional $55,932 |
| Tlingit-Haida | 100.0 /100 | #35 | Exceptional $55,914 |
| Immigrants | Israel | 100.0 /100 | #36 | Exceptional $55,913 |
| Immigrants | Russia | 100.0 /100 | #37 | Exceptional $55,891 |
| Immigrants | Iran | 100.0 /100 | #38 | Exceptional $55,880 |
| Immigrants | Belarus | 100.0 /100 | #39 | Exceptional $55,743 |
| Immigrants | Greece | 100.0 /100 | #40 | Exceptional $55,727 |
| Immigrants | Guyana | 100.0 /100 | #41 | Exceptional $55,726 |
| Immigrants | Korea | 100.0 /100 | #42 | Exceptional $55,716 |
| Immigrants | South Eastern Asia | 100.0 /100 | #43 | Exceptional $55,714 |
| Paraguayans | 100.0 /100 | #44 | Exceptional $55,614 |
| Spanish American Indians | 100.0 /100 | #45 | Exceptional $55,573 |
| Immigrants | Eastern Europe | 100.0 /100 | #46 | Exceptional $55,572 |