Immigrants from Haiti vs Immigrants from Bulgaria Receiving Food Stamps
COMPARE
Immigrants from Haiti
Immigrants from Bulgaria
Receiving Food Stamps
Receiving Food Stamps Comparison
Immigrants from Haiti
Immigrants from Bulgaria
18.2%
RECEIVING FOOD STAMPS
0.0/ 100
METRIC RATING
325th/ 347
METRIC RANK
9.8%
RECEIVING FOOD STAMPS
99.2/ 100
METRIC RATING
62nd/ 347
METRIC RANK
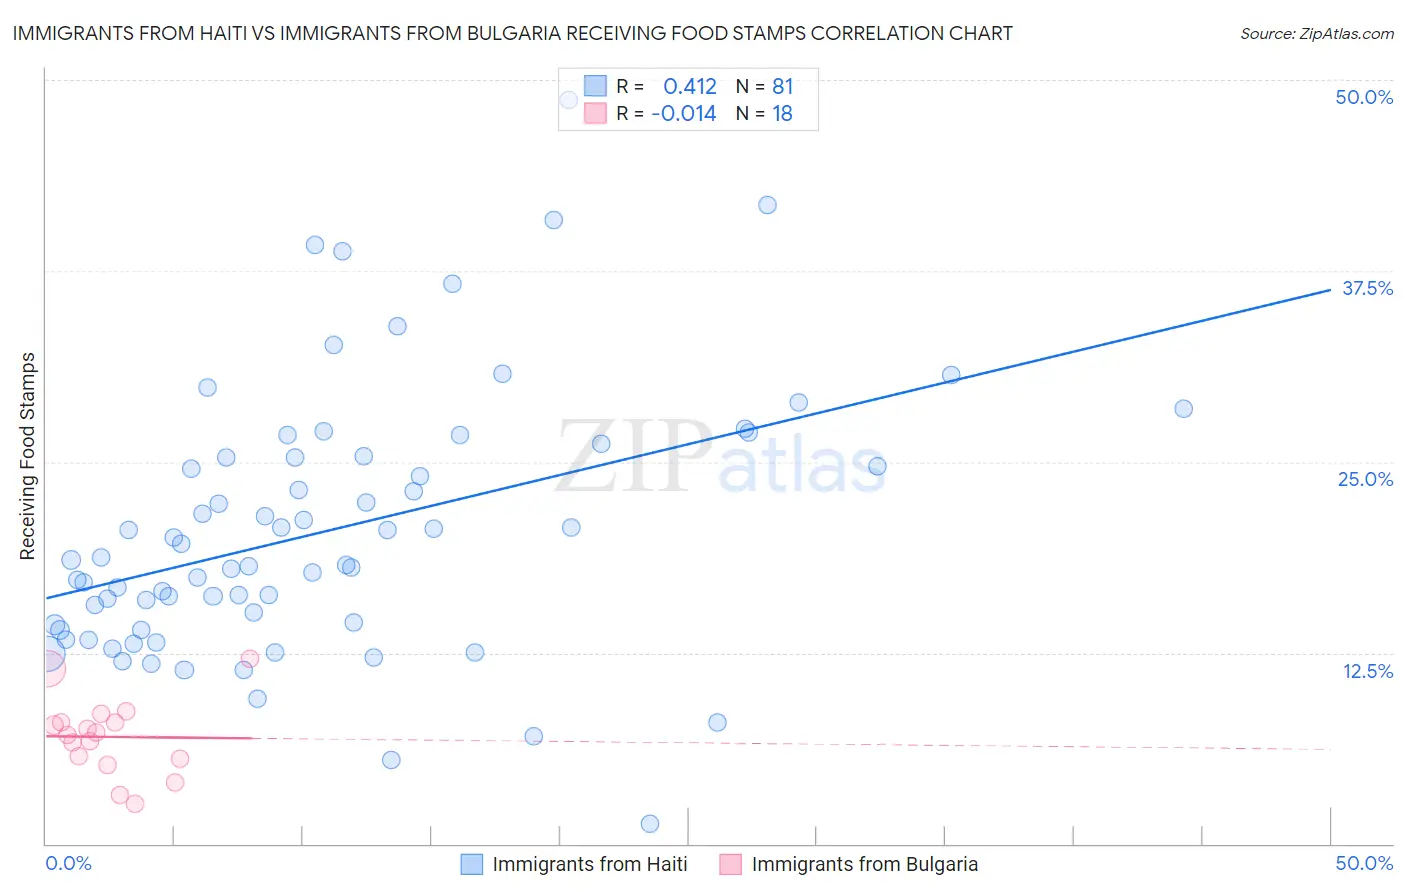
Immigrants from Haiti vs Immigrants from Bulgaria Receiving Food Stamps Correlation Chart
The statistical analysis conducted on geographies consisting of 225,016,016 people shows a moderate positive correlation between the proportion of Immigrants from Haiti and percentage of population receiving government assistance and/or food stamps in the United States with a correlation coefficient (R) of 0.412 and weighted average of 18.2%. Similarly, the statistical analysis conducted on geographies consisting of 172,350,447 people shows no correlation between the proportion of Immigrants from Bulgaria and percentage of population receiving government assistance and/or food stamps in the United States with a correlation coefficient (R) of -0.014 and weighted average of 9.8%, a difference of 86.4%.
Receiving Food Stamps Correlation Summary
| Measurement | Immigrants from Haiti | Immigrants from Bulgaria |
| Minimum | 1.3% | 2.6% |
| Maximum | 48.7% | 12.1% |
| Range | 47.4% | 9.5% |
| Mean | 20.5% | 7.0% |
| Median | 18.6% | 7.2% |
| Interquartile 25% (IQ1) | 14.2% | 5.6% |
| Interquartile 75% (IQ3) | 25.4% | 8.0% |
| Interquartile Range (IQR) | 11.2% | 2.4% |
| Standard Deviation (Sample) | 8.7% | 2.5% |
| Standard Deviation (Population) | 8.7% | 2.4% |
Similar Demographics by Receiving Food Stamps
Demographics Similar to Immigrants from Haiti by Receiving Food Stamps
In terms of receiving food stamps, the demographic groups most similar to Immigrants from Haiti are Cuban (18.2%, a difference of 0.11%), Apache (18.3%, a difference of 0.42%), Colville (18.3%, a difference of 0.63%), Immigrants from Dominica (18.4%, a difference of 1.1%), and British West Indian (17.9%, a difference of 1.8%).
| Demographics | Rating | Rank | Receiving Food Stamps |
| Menominee | 0.0 /100 | #318 | Tragic 17.2% |
| Immigrants | St. Vincent and the Grenadines | 0.0 /100 | #319 | Tragic 17.2% |
| Immigrants | Nicaragua | 0.0 /100 | #320 | Tragic 17.2% |
| Natives/Alaskans | 0.0 /100 | #321 | Tragic 17.3% |
| Immigrants | Grenada | 0.0 /100 | #322 | Tragic 17.8% |
| Haitians | 0.0 /100 | #323 | Tragic 17.8% |
| British West Indians | 0.0 /100 | #324 | Tragic 17.9% |
| Immigrants | Haiti | 0.0 /100 | #325 | Tragic 18.2% |
| Cubans | 0.0 /100 | #326 | Tragic 18.2% |
| Apache | 0.0 /100 | #327 | Tragic 18.3% |
| Colville | 0.0 /100 | #328 | Tragic 18.3% |
| Immigrants | Dominica | 0.0 /100 | #329 | Tragic 18.4% |
| Pima | 0.0 /100 | #330 | Tragic 19.0% |
| Immigrants | Caribbean | 0.0 /100 | #331 | Tragic 19.6% |
| Pueblo | 0.0 /100 | #332 | Tragic 19.9% |
Demographics Similar to Immigrants from Bulgaria by Receiving Food Stamps
In terms of receiving food stamps, the demographic groups most similar to Immigrants from Bulgaria are Chinese (9.8%, a difference of 0.030%), English (9.8%, a difference of 0.080%), Immigrants from North America (9.8%, a difference of 0.12%), German (9.7%, a difference of 0.22%), and Immigrants from Turkey (9.8%, a difference of 0.28%).
| Demographics | Rating | Rank | Receiving Food Stamps |
| Immigrants | Switzerland | 99.3 /100 | #55 | Exceptional 9.7% |
| Immigrants | Canada | 99.3 /100 | #56 | Exceptional 9.7% |
| Greeks | 99.3 /100 | #57 | Exceptional 9.7% |
| Scandinavians | 99.2 /100 | #58 | Exceptional 9.7% |
| British | 99.2 /100 | #59 | Exceptional 9.7% |
| Germans | 99.2 /100 | #60 | Exceptional 9.7% |
| English | 99.2 /100 | #61 | Exceptional 9.8% |
| Immigrants | Bulgaria | 99.2 /100 | #62 | Exceptional 9.8% |
| Chinese | 99.2 /100 | #63 | Exceptional 9.8% |
| Immigrants | North America | 99.2 /100 | #64 | Exceptional 9.8% |
| Immigrants | Turkey | 99.1 /100 | #65 | Exceptional 9.8% |
| Slovenes | 99.1 /100 | #66 | Exceptional 9.8% |
| Immigrants | Indonesia | 99.0 /100 | #67 | Exceptional 9.8% |
| Northern Europeans | 99.0 /100 | #68 | Exceptional 9.8% |
| Italians | 99.0 /100 | #69 | Exceptional 9.9% |