Immigrants from Guyana vs Hungarian Female Poverty Among 25-34 Year Olds
COMPARE
Immigrants from Guyana
Hungarian
Female Poverty Among 25-34 Year Olds
Female Poverty Among 25-34 Year Olds Comparison
Immigrants from Guyana
Hungarians
14.3%
FEMALE POVERTY AMONG 25-34 YEAR OLDS
6.6/ 100
METRIC RATING
212th/ 347
METRIC RANK
14.1%
FEMALE POVERTY AMONG 25-34 YEAR OLDS
11.8/ 100
METRIC RATING
206th/ 347
METRIC RANK
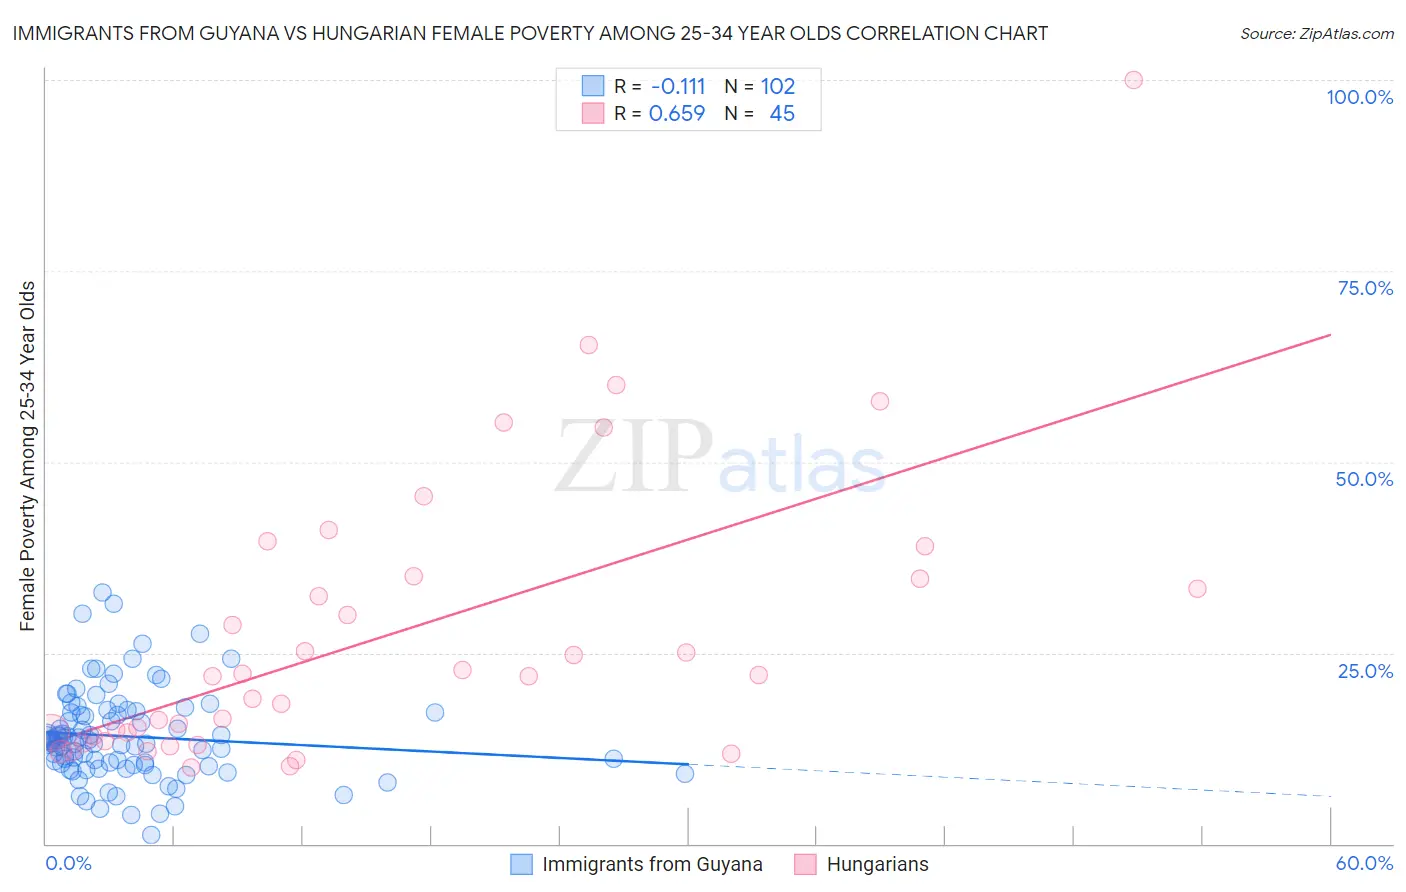
Immigrants from Guyana vs Hungarian Female Poverty Among 25-34 Year Olds Correlation Chart
The statistical analysis conducted on geographies consisting of 181,727,129 people shows a poor negative correlation between the proportion of Immigrants from Guyana and poverty level among females between the ages 25 and 34 in the United States with a correlation coefficient (R) of -0.111 and weighted average of 14.3%. Similarly, the statistical analysis conducted on geographies consisting of 472,494,833 people shows a significant positive correlation between the proportion of Hungarians and poverty level among females between the ages 25 and 34 in the United States with a correlation coefficient (R) of 0.659 and weighted average of 14.1%, a difference of 1.3%.
Female Poverty Among 25-34 Year Olds Correlation Summary
| Measurement | Immigrants from Guyana | Hungarian |
| Minimum | 1.1% | 10.0% |
| Maximum | 32.9% | 100.0% |
| Range | 31.7% | 90.0% |
| Mean | 14.1% | 27.3% |
| Median | 13.3% | 21.9% |
| Interquartile 25% (IQ1) | 10.3% | 13.7% |
| Interquartile 75% (IQ3) | 17.2% | 34.9% |
| Interquartile Range (IQR) | 6.9% | 21.1% |
| Standard Deviation (Sample) | 5.9% | 18.7% |
| Standard Deviation (Population) | 5.9% | 18.5% |
Demographics Similar to Immigrants from Guyana and Hungarians by Female Poverty Among 25-34 Year Olds
In terms of female poverty among 25-34 year olds, the demographic groups most similar to Immigrants from Guyana are Puget Sound Salish (14.3%, a difference of 0.030%), French (14.3%, a difference of 0.13%), Immigrants from Nigeria (14.3%, a difference of 0.15%), French Canadian (14.3%, a difference of 0.40%), and Spanish American Indian (14.3%, a difference of 0.40%). Similarly, the demographic groups most similar to Hungarians are Japanese (14.1%, a difference of 0.020%), Immigrants from Panama (14.1%, a difference of 0.040%), Immigrants from Africa (14.1%, a difference of 0.28%), Hawaiian (14.1%, a difference of 0.33%), and Immigrants (14.0%, a difference of 0.48%).
| Demographics | Rating | Rank | Female Poverty Among 25-34 Year Olds |
| English | 20.4 /100 | #199 | Fair 13.9% |
| Hmong | 20.3 /100 | #200 | Fair 13.9% |
| Immigrants | Trinidad and Tobago | 17.6 /100 | #201 | Poor 14.0% |
| Welsh | 17.2 /100 | #202 | Poor 14.0% |
| Immigrants | Immigrants | 14.5 /100 | #203 | Poor 14.0% |
| Hawaiians | 13.6 /100 | #204 | Poor 14.1% |
| Immigrants | Africa | 13.4 /100 | #205 | Poor 14.1% |
| Hungarians | 11.8 /100 | #206 | Poor 14.1% |
| Japanese | 11.7 /100 | #207 | Poor 14.1% |
| Immigrants | Panama | 11.6 /100 | #208 | Poor 14.1% |
| Guyanese | 8.6 /100 | #209 | Tragic 14.2% |
| Panamanians | 8.6 /100 | #210 | Tragic 14.2% |
| Trinidadians and Tobagonians | 8.2 /100 | #211 | Tragic 14.2% |
| Immigrants | Guyana | 6.6 /100 | #212 | Tragic 14.3% |
| Puget Sound Salish | 6.5 /100 | #213 | Tragic 14.3% |
| French | 6.2 /100 | #214 | Tragic 14.3% |
| Immigrants | Nigeria | 6.2 /100 | #215 | Tragic 14.3% |
| French Canadians | 5.5 /100 | #216 | Tragic 14.3% |
| Spanish American Indians | 5.5 /100 | #217 | Tragic 14.3% |
| Immigrants | Thailand | 5.2 /100 | #218 | Tragic 14.3% |
| Ecuadorians | 5.2 /100 | #219 | Tragic 14.3% |