Immigrants from Guyana vs Immigrants from Czechoslovakia Female Poverty Among 25-34 Year Olds
COMPARE
Immigrants from Guyana
Immigrants from Czechoslovakia
Female Poverty Among 25-34 Year Olds
Female Poverty Among 25-34 Year Olds Comparison
Immigrants from Guyana
Immigrants from Czechoslovakia
14.3%
FEMALE POVERTY AMONG 25-34 YEAR OLDS
6.6/ 100
METRIC RATING
212th/ 347
METRIC RANK
12.1%
FEMALE POVERTY AMONG 25-34 YEAR OLDS
99.4/ 100
METRIC RATING
61st/ 347
METRIC RANK
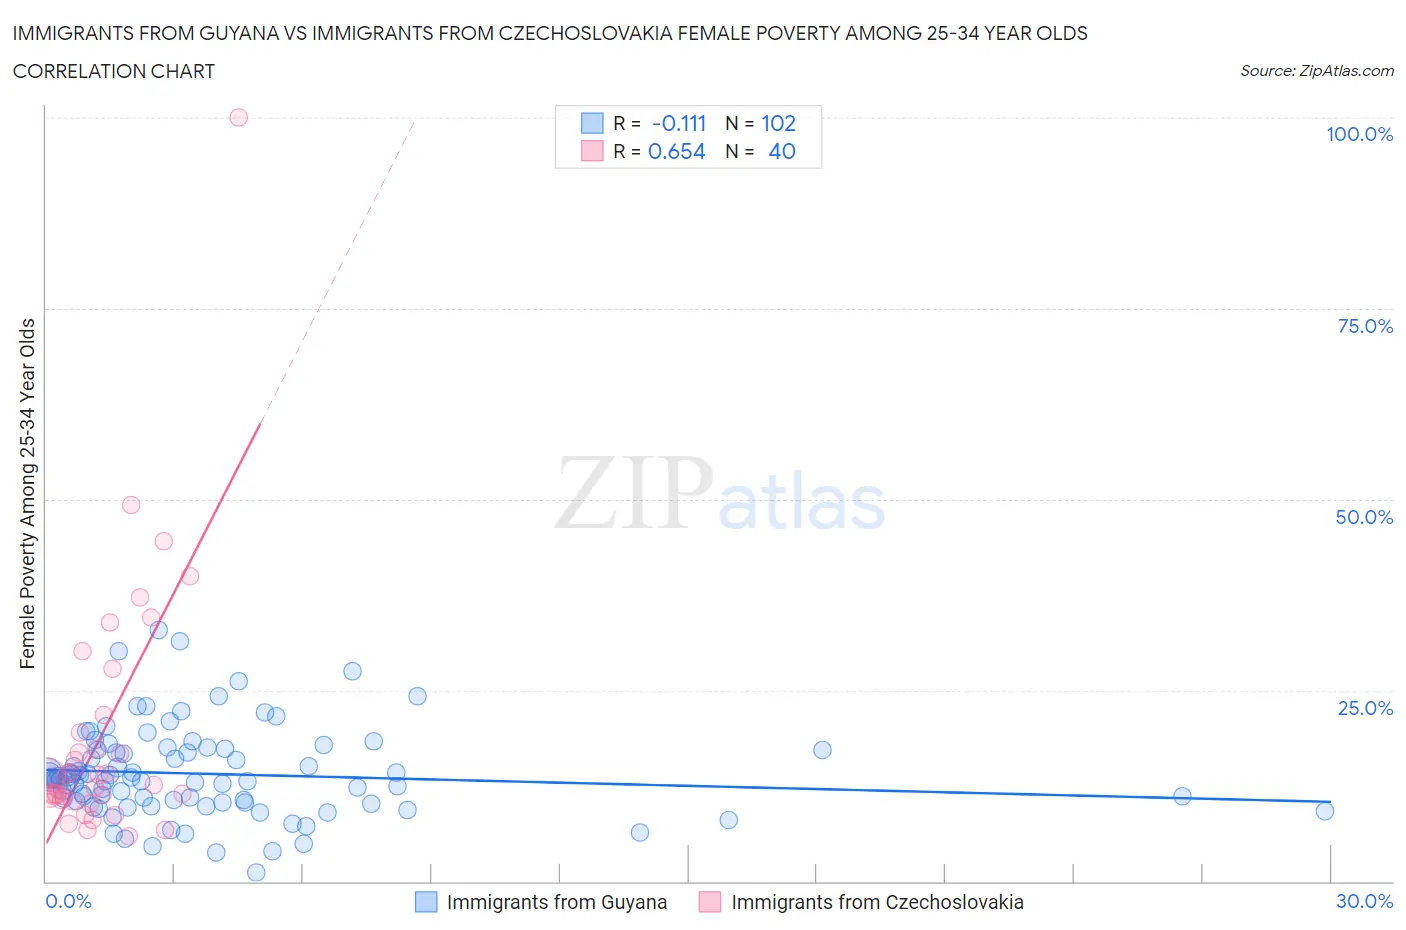
Immigrants from Guyana vs Immigrants from Czechoslovakia Female Poverty Among 25-34 Year Olds Correlation Chart
The statistical analysis conducted on geographies consisting of 181,727,129 people shows a poor negative correlation between the proportion of Immigrants from Guyana and poverty level among females between the ages 25 and 34 in the United States with a correlation coefficient (R) of -0.111 and weighted average of 14.3%. Similarly, the statistical analysis conducted on geographies consisting of 193,241,003 people shows a significant positive correlation between the proportion of Immigrants from Czechoslovakia and poverty level among females between the ages 25 and 34 in the United States with a correlation coefficient (R) of 0.654 and weighted average of 12.1%, a difference of 17.9%.
Female Poverty Among 25-34 Year Olds Correlation Summary
| Measurement | Immigrants from Guyana | Immigrants from Czechoslovakia |
| Minimum | 1.1% | 5.8% |
| Maximum | 32.9% | 100.0% |
| Range | 31.7% | 94.2% |
| Mean | 14.1% | 19.4% |
| Median | 13.3% | 13.2% |
| Interquartile 25% (IQ1) | 10.3% | 10.9% |
| Interquartile 75% (IQ3) | 17.2% | 20.6% |
| Interquartile Range (IQR) | 6.9% | 9.7% |
| Standard Deviation (Sample) | 5.9% | 17.1% |
| Standard Deviation (Population) | 5.9% | 16.9% |
Similar Demographics by Female Poverty Among 25-34 Year Olds
Demographics Similar to Immigrants from Guyana by Female Poverty Among 25-34 Year Olds
In terms of female poverty among 25-34 year olds, the demographic groups most similar to Immigrants from Guyana are Puget Sound Salish (14.3%, a difference of 0.030%), French (14.3%, a difference of 0.13%), Immigrants from Nigeria (14.3%, a difference of 0.15%), French Canadian (14.3%, a difference of 0.40%), and Spanish American Indian (14.3%, a difference of 0.40%).
| Demographics | Rating | Rank | Female Poverty Among 25-34 Year Olds |
| Immigrants | Africa | 13.4 /100 | #205 | Poor 14.1% |
| Hungarians | 11.8 /100 | #206 | Poor 14.1% |
| Japanese | 11.7 /100 | #207 | Poor 14.1% |
| Immigrants | Panama | 11.6 /100 | #208 | Poor 14.1% |
| Guyanese | 8.6 /100 | #209 | Tragic 14.2% |
| Panamanians | 8.6 /100 | #210 | Tragic 14.2% |
| Trinidadians and Tobagonians | 8.2 /100 | #211 | Tragic 14.2% |
| Immigrants | Guyana | 6.6 /100 | #212 | Tragic 14.3% |
| Puget Sound Salish | 6.5 /100 | #213 | Tragic 14.3% |
| French | 6.2 /100 | #214 | Tragic 14.3% |
| Immigrants | Nigeria | 6.2 /100 | #215 | Tragic 14.3% |
| French Canadians | 5.5 /100 | #216 | Tragic 14.3% |
| Spanish American Indians | 5.5 /100 | #217 | Tragic 14.3% |
| Immigrants | Thailand | 5.2 /100 | #218 | Tragic 14.3% |
| Ecuadorians | 5.2 /100 | #219 | Tragic 14.3% |
Demographics Similar to Immigrants from Czechoslovakia by Female Poverty Among 25-34 Year Olds
In terms of female poverty among 25-34 year olds, the demographic groups most similar to Immigrants from Czechoslovakia are Immigrants from Northern Europe (12.1%, a difference of 0.020%), Immigrants from Romania (12.1%, a difference of 0.11%), Russian (12.1%, a difference of 0.11%), Immigrants from Moldova (12.1%, a difference of 0.17%), and Soviet Union (12.1%, a difference of 0.18%).
| Demographics | Rating | Rank | Female Poverty Among 25-34 Year Olds |
| Eastern Europeans | 99.6 /100 | #54 | Exceptional 12.0% |
| Immigrants | Philippines | 99.5 /100 | #55 | Exceptional 12.0% |
| Luxembourgers | 99.5 /100 | #56 | Exceptional 12.1% |
| Jordanians | 99.4 /100 | #57 | Exceptional 12.1% |
| Immigrants | Romania | 99.4 /100 | #58 | Exceptional 12.1% |
| Russians | 99.4 /100 | #59 | Exceptional 12.1% |
| Immigrants | Northern Europe | 99.4 /100 | #60 | Exceptional 12.1% |
| Immigrants | Czechoslovakia | 99.4 /100 | #61 | Exceptional 12.1% |
| Immigrants | Moldova | 99.3 /100 | #62 | Exceptional 12.1% |
| Soviet Union | 99.3 /100 | #63 | Exceptional 12.1% |
| Immigrants | Russia | 99.2 /100 | #64 | Exceptional 12.2% |
| Armenians | 99.2 /100 | #65 | Exceptional 12.2% |
| Immigrants | Europe | 99.2 /100 | #66 | Exceptional 12.2% |
| Laotians | 99.2 /100 | #67 | Exceptional 12.2% |
| Sri Lankans | 99.1 /100 | #68 | Exceptional 12.2% |