Sri Lankan vs Hungarian Female Poverty Among 25-34 Year Olds
COMPARE
Sri Lankan
Hungarian
Female Poverty Among 25-34 Year Olds
Female Poverty Among 25-34 Year Olds Comparison
Sri Lankans
Hungarians
12.2%
FEMALE POVERTY AMONG 25-34 YEAR OLDS
99.1/ 100
METRIC RATING
68th/ 347
METRIC RANK
14.1%
FEMALE POVERTY AMONG 25-34 YEAR OLDS
11.8/ 100
METRIC RATING
206th/ 347
METRIC RANK
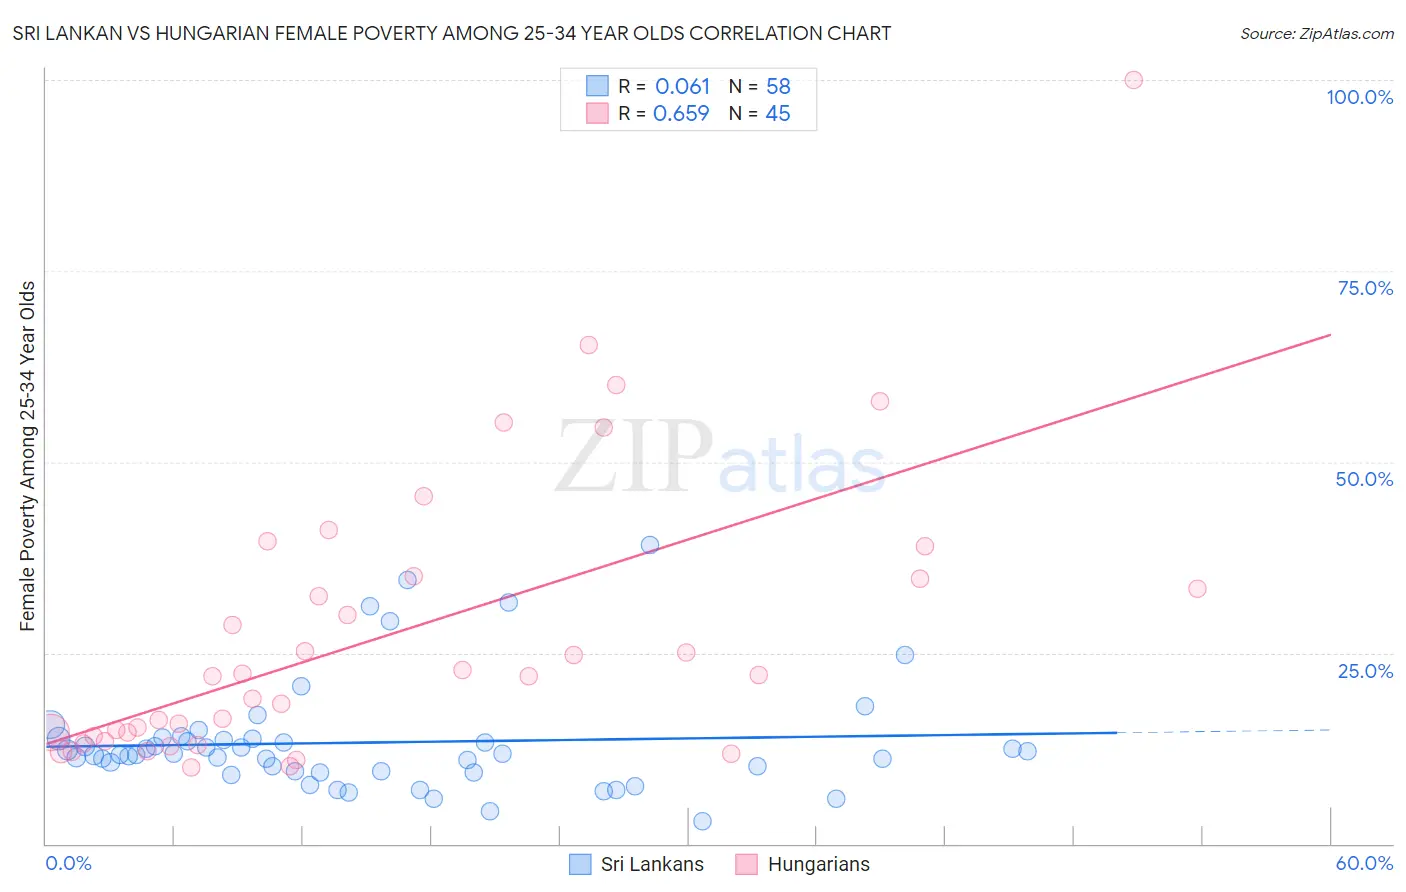
Sri Lankan vs Hungarian Female Poverty Among 25-34 Year Olds Correlation Chart
The statistical analysis conducted on geographies consisting of 433,227,670 people shows a slight positive correlation between the proportion of Sri Lankans and poverty level among females between the ages 25 and 34 in the United States with a correlation coefficient (R) of 0.061 and weighted average of 12.2%. Similarly, the statistical analysis conducted on geographies consisting of 472,494,833 people shows a significant positive correlation between the proportion of Hungarians and poverty level among females between the ages 25 and 34 in the United States with a correlation coefficient (R) of 0.659 and weighted average of 14.1%, a difference of 15.5%.
Female Poverty Among 25-34 Year Olds Correlation Summary
| Measurement | Sri Lankan | Hungarian |
| Minimum | 3.0% | 10.0% |
| Maximum | 39.1% | 100.0% |
| Range | 36.1% | 90.0% |
| Mean | 13.2% | 27.3% |
| Median | 11.8% | 21.9% |
| Interquartile 25% (IQ1) | 9.4% | 13.7% |
| Interquartile 75% (IQ3) | 13.7% | 34.9% |
| Interquartile Range (IQR) | 4.2% | 21.1% |
| Standard Deviation (Sample) | 7.2% | 18.7% |
| Standard Deviation (Population) | 7.2% | 18.5% |
Similar Demographics by Female Poverty Among 25-34 Year Olds
Demographics Similar to Sri Lankans by Female Poverty Among 25-34 Year Olds
In terms of female poverty among 25-34 year olds, the demographic groups most similar to Sri Lankans are Immigrants from Lebanon (12.2%, a difference of 0.030%), Immigrants from Belgium (12.2%, a difference of 0.060%), Immigrants from Scotland (12.2%, a difference of 0.070%), Lithuanian (12.2%, a difference of 0.12%), and Laotian (12.2%, a difference of 0.21%).
| Demographics | Rating | Rank | Female Poverty Among 25-34 Year Olds |
| Immigrants | Czechoslovakia | 99.4 /100 | #61 | Exceptional 12.1% |
| Immigrants | Moldova | 99.3 /100 | #62 | Exceptional 12.1% |
| Soviet Union | 99.3 /100 | #63 | Exceptional 12.1% |
| Immigrants | Russia | 99.2 /100 | #64 | Exceptional 12.2% |
| Armenians | 99.2 /100 | #65 | Exceptional 12.2% |
| Immigrants | Europe | 99.2 /100 | #66 | Exceptional 12.2% |
| Laotians | 99.2 /100 | #67 | Exceptional 12.2% |
| Sri Lankans | 99.1 /100 | #68 | Exceptional 12.2% |
| Immigrants | Lebanon | 99.1 /100 | #69 | Exceptional 12.2% |
| Immigrants | Belgium | 99.1 /100 | #70 | Exceptional 12.2% |
| Immigrants | Scotland | 99.1 /100 | #71 | Exceptional 12.2% |
| Lithuanians | 99.1 /100 | #72 | Exceptional 12.2% |
| Immigrants | Vietnam | 98.9 /100 | #73 | Exceptional 12.3% |
| Immigrants | Sweden | 98.9 /100 | #74 | Exceptional 12.3% |
| Estonians | 98.9 /100 | #75 | Exceptional 12.3% |
Demographics Similar to Hungarians by Female Poverty Among 25-34 Year Olds
In terms of female poverty among 25-34 year olds, the demographic groups most similar to Hungarians are Japanese (14.1%, a difference of 0.020%), Immigrants from Panama (14.1%, a difference of 0.040%), Immigrants from Africa (14.1%, a difference of 0.28%), Hawaiian (14.1%, a difference of 0.33%), and Immigrants (14.0%, a difference of 0.48%).
| Demographics | Rating | Rank | Female Poverty Among 25-34 Year Olds |
| English | 20.4 /100 | #199 | Fair 13.9% |
| Hmong | 20.3 /100 | #200 | Fair 13.9% |
| Immigrants | Trinidad and Tobago | 17.6 /100 | #201 | Poor 14.0% |
| Welsh | 17.2 /100 | #202 | Poor 14.0% |
| Immigrants | Immigrants | 14.5 /100 | #203 | Poor 14.0% |
| Hawaiians | 13.6 /100 | #204 | Poor 14.1% |
| Immigrants | Africa | 13.4 /100 | #205 | Poor 14.1% |
| Hungarians | 11.8 /100 | #206 | Poor 14.1% |
| Japanese | 11.7 /100 | #207 | Poor 14.1% |
| Immigrants | Panama | 11.6 /100 | #208 | Poor 14.1% |
| Guyanese | 8.6 /100 | #209 | Tragic 14.2% |
| Panamanians | 8.6 /100 | #210 | Tragic 14.2% |
| Trinidadians and Tobagonians | 8.2 /100 | #211 | Tragic 14.2% |
| Immigrants | Guyana | 6.6 /100 | #212 | Tragic 14.3% |
| Puget Sound Salish | 6.5 /100 | #213 | Tragic 14.3% |