Immigrants from Syria vs Hungarian Female Poverty Among 25-34 Year Olds
COMPARE
Immigrants from Syria
Hungarian
Female Poverty Among 25-34 Year Olds
Female Poverty Among 25-34 Year Olds Comparison
Immigrants from Syria
Hungarians
12.8%
FEMALE POVERTY AMONG 25-34 YEAR OLDS
93.8/ 100
METRIC RATING
113th/ 347
METRIC RANK
14.1%
FEMALE POVERTY AMONG 25-34 YEAR OLDS
11.8/ 100
METRIC RATING
206th/ 347
METRIC RANK
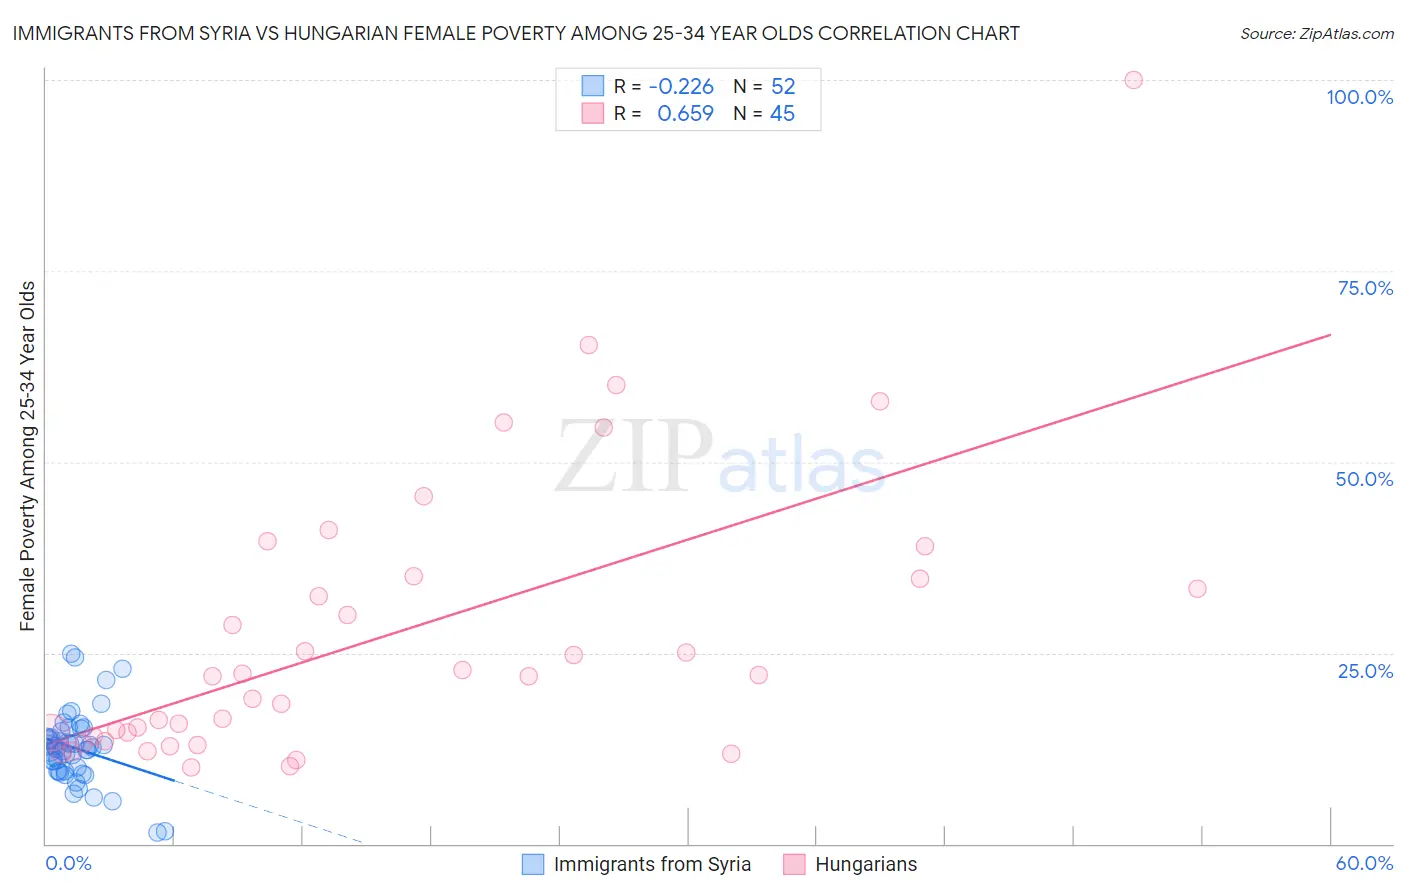
Immigrants from Syria vs Hungarian Female Poverty Among 25-34 Year Olds Correlation Chart
The statistical analysis conducted on geographies consisting of 173,105,379 people shows a weak negative correlation between the proportion of Immigrants from Syria and poverty level among females between the ages 25 and 34 in the United States with a correlation coefficient (R) of -0.226 and weighted average of 12.8%. Similarly, the statistical analysis conducted on geographies consisting of 472,494,833 people shows a significant positive correlation between the proportion of Hungarians and poverty level among females between the ages 25 and 34 in the United States with a correlation coefficient (R) of 0.659 and weighted average of 14.1%, a difference of 10.4%.
Female Poverty Among 25-34 Year Olds Correlation Summary
| Measurement | Immigrants from Syria | Hungarian |
| Minimum | 1.4% | 10.0% |
| Maximum | 24.9% | 100.0% |
| Range | 23.5% | 90.0% |
| Mean | 12.5% | 27.3% |
| Median | 12.6% | 21.9% |
| Interquartile 25% (IQ1) | 9.5% | 13.7% |
| Interquartile 75% (IQ3) | 14.3% | 34.9% |
| Interquartile Range (IQR) | 4.8% | 21.1% |
| Standard Deviation (Sample) | 4.7% | 18.7% |
| Standard Deviation (Population) | 4.6% | 18.5% |
Similar Demographics by Female Poverty Among 25-34 Year Olds
Demographics Similar to Immigrants from Syria by Female Poverty Among 25-34 Year Olds
In terms of female poverty among 25-34 year olds, the demographic groups most similar to Immigrants from Syria are Immigrants from Morocco (12.8%, a difference of 0.040%), Danish (12.8%, a difference of 0.060%), Immigrants from Southern Europe (12.8%, a difference of 0.070%), Australian (12.8%, a difference of 0.13%), and Immigrants from Brazil (12.8%, a difference of 0.16%).
| Demographics | Rating | Rank | Female Poverty Among 25-34 Year Olds |
| Tsimshian | 95.1 /100 | #106 | Exceptional 12.7% |
| Poles | 94.9 /100 | #107 | Exceptional 12.7% |
| Immigrants | Norway | 94.4 /100 | #108 | Exceptional 12.7% |
| Immigrants | Peru | 94.3 /100 | #109 | Exceptional 12.7% |
| Australians | 94.1 /100 | #110 | Exceptional 12.8% |
| Danes | 93.9 /100 | #111 | Exceptional 12.8% |
| Immigrants | Morocco | 93.9 /100 | #112 | Exceptional 12.8% |
| Immigrants | Syria | 93.8 /100 | #113 | Exceptional 12.8% |
| Immigrants | Southern Europe | 93.6 /100 | #114 | Exceptional 12.8% |
| Immigrants | Brazil | 93.3 /100 | #115 | Exceptional 12.8% |
| Chileans | 93.2 /100 | #116 | Exceptional 12.8% |
| Immigrants | Kuwait | 93.1 /100 | #117 | Exceptional 12.8% |
| Mongolians | 93.0 /100 | #118 | Exceptional 12.8% |
| Immigrants | Nepal | 93.0 /100 | #119 | Exceptional 12.8% |
| Carpatho Rusyns | 93.0 /100 | #120 | Exceptional 12.8% |
Demographics Similar to Hungarians by Female Poverty Among 25-34 Year Olds
In terms of female poverty among 25-34 year olds, the demographic groups most similar to Hungarians are Japanese (14.1%, a difference of 0.020%), Immigrants from Panama (14.1%, a difference of 0.040%), Immigrants from Africa (14.1%, a difference of 0.28%), Hawaiian (14.1%, a difference of 0.33%), and Immigrants (14.0%, a difference of 0.48%).
| Demographics | Rating | Rank | Female Poverty Among 25-34 Year Olds |
| English | 20.4 /100 | #199 | Fair 13.9% |
| Hmong | 20.3 /100 | #200 | Fair 13.9% |
| Immigrants | Trinidad and Tobago | 17.6 /100 | #201 | Poor 14.0% |
| Welsh | 17.2 /100 | #202 | Poor 14.0% |
| Immigrants | Immigrants | 14.5 /100 | #203 | Poor 14.0% |
| Hawaiians | 13.6 /100 | #204 | Poor 14.1% |
| Immigrants | Africa | 13.4 /100 | #205 | Poor 14.1% |
| Hungarians | 11.8 /100 | #206 | Poor 14.1% |
| Japanese | 11.7 /100 | #207 | Poor 14.1% |
| Immigrants | Panama | 11.6 /100 | #208 | Poor 14.1% |
| Guyanese | 8.6 /100 | #209 | Tragic 14.2% |
| Panamanians | 8.6 /100 | #210 | Tragic 14.2% |
| Trinidadians and Tobagonians | 8.2 /100 | #211 | Tragic 14.2% |
| Immigrants | Guyana | 6.6 /100 | #212 | Tragic 14.3% |
| Puget Sound Salish | 6.5 /100 | #213 | Tragic 14.3% |