Immigrants from Guyana vs Hungarian Vision Disability
COMPARE
Immigrants from Guyana
Hungarian
Vision Disability
Vision Disability Comparison
Immigrants from Guyana
Hungarians
2.2%
VISION DISABILITY
15.9/ 100
METRIC RATING
204th/ 347
METRIC RANK
2.1%
VISION DISABILITY
67.4/ 100
METRIC RATING
162nd/ 347
METRIC RANK
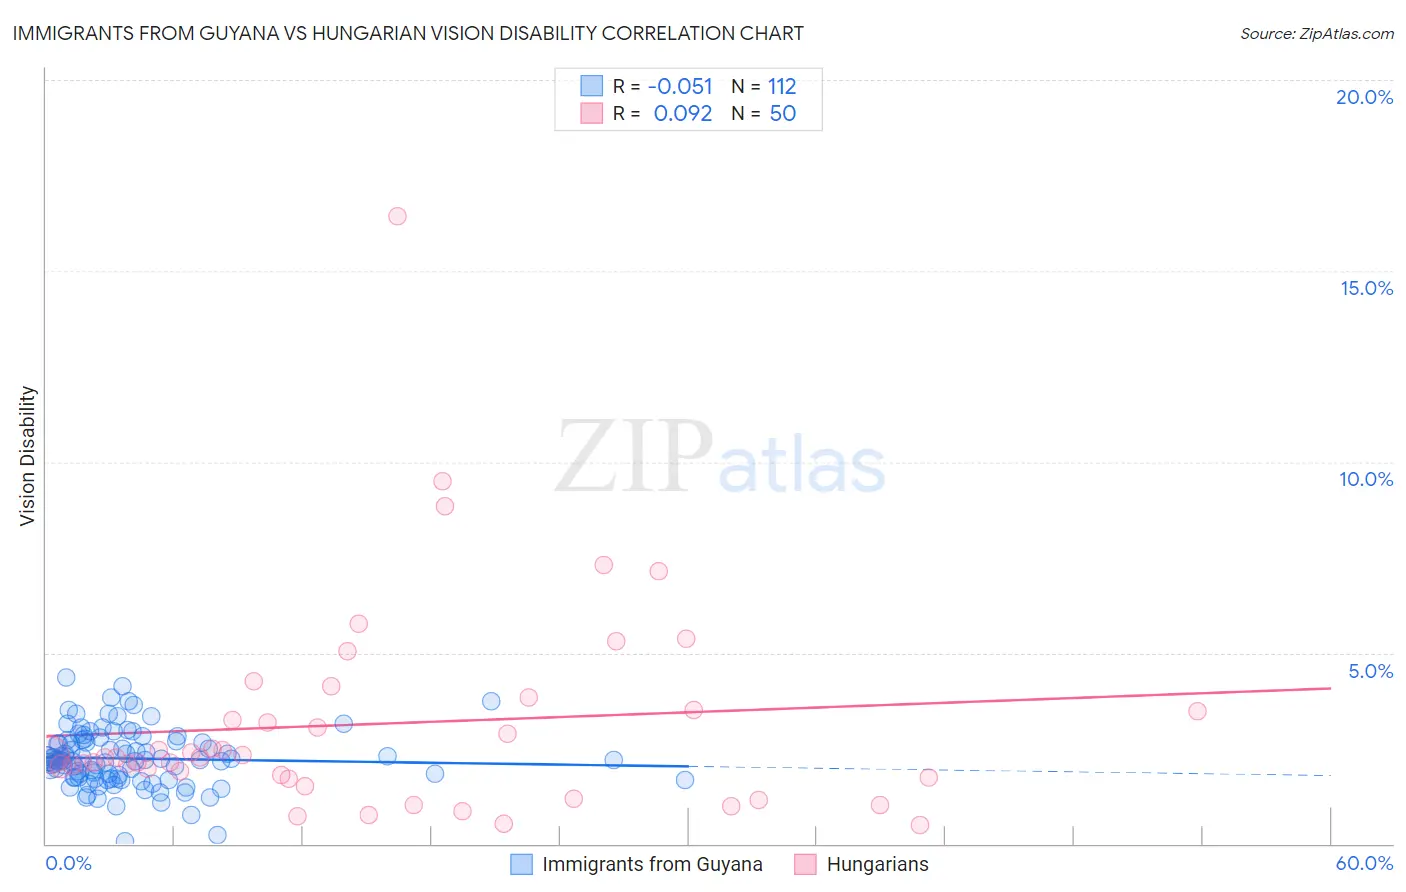
Immigrants from Guyana vs Hungarian Vision Disability Correlation Chart
The statistical analysis conducted on geographies consisting of 183,609,151 people shows a slight negative correlation between the proportion of Immigrants from Guyana and percentage of population with vision disability in the United States with a correlation coefficient (R) of -0.051 and weighted average of 2.2%. Similarly, the statistical analysis conducted on geographies consisting of 485,432,648 people shows a slight positive correlation between the proportion of Hungarians and percentage of population with vision disability in the United States with a correlation coefficient (R) of 0.092 and weighted average of 2.1%, a difference of 3.8%.
Vision Disability Correlation Summary
| Measurement | Immigrants from Guyana | Hungarian |
| Minimum | 0.051% | 0.49% |
| Maximum | 4.4% | 16.4% |
| Range | 4.3% | 15.9% |
| Mean | 2.2% | 3.1% |
| Median | 2.2% | 2.3% |
| Interquartile 25% (IQ1) | 1.7% | 1.7% |
| Interquartile 75% (IQ3) | 2.7% | 3.5% |
| Interquartile Range (IQR) | 0.95% | 1.8% |
| Standard Deviation (Sample) | 0.74% | 2.8% |
| Standard Deviation (Population) | 0.74% | 2.8% |
Similar Demographics by Vision Disability
Demographics Similar to Immigrants from Guyana by Vision Disability
In terms of vision disability, the demographic groups most similar to Immigrants from Guyana are Samoan (2.2%, a difference of 0.030%), Dutch (2.2%, a difference of 0.13%), Pennsylvania German (2.2%, a difference of 0.17%), Immigrants from Zaire (2.2%, a difference of 0.23%), and Immigrants from Nigeria (2.2%, a difference of 0.30%).
| Demographics | Rating | Rank | Vision Disability |
| Ghanaians | 21.8 /100 | #197 | Fair 2.2% |
| Czechoslovakians | 21.6 /100 | #198 | Fair 2.2% |
| Immigrants | El Salvador | 21.0 /100 | #199 | Fair 2.2% |
| Immigrants | Thailand | 20.1 /100 | #200 | Fair 2.2% |
| Slovaks | 18.8 /100 | #201 | Poor 2.2% |
| Immigrants | Zaire | 18.0 /100 | #202 | Poor 2.2% |
| Dutch | 17.1 /100 | #203 | Poor 2.2% |
| Immigrants | Guyana | 15.9 /100 | #204 | Poor 2.2% |
| Samoans | 15.7 /100 | #205 | Poor 2.2% |
| Pennsylvania Germans | 14.5 /100 | #206 | Poor 2.2% |
| Immigrants | Nigeria | 13.5 /100 | #207 | Poor 2.2% |
| Germans | 13.4 /100 | #208 | Poor 2.2% |
| Immigrants | Brazil | 13.1 /100 | #209 | Poor 2.2% |
| Immigrants | Uruguay | 11.5 /100 | #210 | Poor 2.2% |
| Indonesians | 9.5 /100 | #211 | Tragic 2.2% |
Demographics Similar to Hungarians by Vision Disability
In terms of vision disability, the demographic groups most similar to Hungarians are Iraqi (2.1%, a difference of 0.030%), Icelander (2.1%, a difference of 0.090%), Austrian (2.1%, a difference of 0.12%), Immigrants from Bangladesh (2.1%, a difference of 0.13%), and South African (2.1%, a difference of 0.18%).
| Demographics | Rating | Rank | Vision Disability |
| Immigrants | Colombia | 72.1 /100 | #155 | Good 2.1% |
| Pakistanis | 71.6 /100 | #156 | Good 2.1% |
| Serbians | 70.2 /100 | #157 | Good 2.1% |
| Immigrants | Uzbekistan | 69.9 /100 | #158 | Good 2.1% |
| South Africans | 69.8 /100 | #159 | Good 2.1% |
| Austrians | 69.0 /100 | #160 | Good 2.1% |
| Iraqis | 67.7 /100 | #161 | Good 2.1% |
| Hungarians | 67.4 /100 | #162 | Good 2.1% |
| Icelanders | 66.1 /100 | #163 | Good 2.1% |
| Immigrants | Bangladesh | 65.5 /100 | #164 | Good 2.1% |
| Immigrants | Iraq | 64.8 /100 | #165 | Good 2.1% |
| Immigrants | England | 62.8 /100 | #166 | Good 2.1% |
| Immigrants | Africa | 62.6 /100 | #167 | Good 2.1% |
| Brazilians | 62.2 /100 | #168 | Good 2.1% |
| South American Indians | 57.4 /100 | #169 | Average 2.2% |